Using Sentry for performance monitoring
Thomas Bianco11 min read

Sentry is a powerful monitoring tool that you might be using to catch bugs and defects in your application. But did you know it comes with many other capabilities? Here, you’ll learn how to leverage Sentry to monitor the performance of your application and gain insights into how to improve it.
Performance is a key aspect of your application. We’ve all seen the numbers: page load time directly impacts conversion rate and user experience. Here’s how monitoring can improve your website’s performance:
- It helps you identify choke points and performance issues. Just like error monitoring, performance monitoring alerts you when things go wrong. If you release code often, a performance regression might slip past your code reviewers, and suddenly a critical API route runs twice as slow. Or maybe the volume of your data crept up without you noticing? Whatever the reason, you’ll notice the issue earlier than if you wait for feedback from users, and maybe before the problem gets so bad that they notice it themselves!
- It allows you to dig into the root cause of performance issues. Automatic profiling is to performance monitoring as logging is to error monitoring: an indispensable tool to analyze your issues. Once you’ve noticed a potential improvement, analyzing the execution traces recorded by your monitoring tool will help you pin down what’s so slow about that operation. Is it a particularly slow DB query? Is an HTTP call taking longer than expected? Is your code looping more times than you thought?
Sounds great, doesn’t it? And I have good news: if you’re already using Sentry for error monitoring, you’re only a few steps away from enabling performance monitoring and reaping all its benefits.
Setup Sentry Performance Monitoring in a few lines of code
To enable performance monitoring, you need to configure the tracing of your transactions. Tracing will add details to the events that Sentry captures: how much time the application spends on each request, what type of operation takes the most time (a database query? an HTTP request?)
The exact process will depend on the technologies you are using, but most Sentry integrations come with tracing included. You just need to add a configuration option when initializing your Sentry SDK to specify how often transactions should be recorded. So, if you’re already using a Sentry integration to automatically capture exceptions, enabling tracing is effortless.
For example, in Django, this is done through the traces_sample_rate option:
import sentry_sdk
from sentry_sdk.integrations.django import DjangoIntegration

sentry_sdk.init(
        dsn=<YOUR_DSN>,
        integrations=[DjangoIntegration()],
        traces_sample_rate=1.0,
)
As the Sentry documentation advises, you should lower the sample rate in production to avoid overloading your application and keep your Sentry data volume in control, but sampling every transaction is great at first to ensure tracing is working properly.
Note that you can also define a trace_sampler function to configure sampling differently depending on transactions, or ignore certain transactions entirely.
Learn to parse all the metrics Sentry offers you
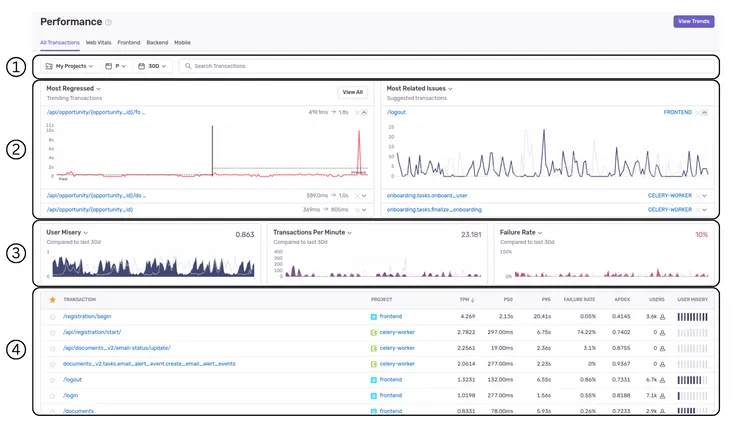
Now that you’re set up, head to the Sentry Performance tab. Your first visit might be overwhelming, but you can find a lot of insightful data there.
-
You can filter which transactions are taken into account on the page. I recommend at least filtering to only analyze transactions in a single environment, as it gets confusing when your data includes multiple environments or projects. You can also search for a specific transaction, or a set of routes if you use wildcards in your search query (/api/internal/* for all routes under that domain, for example)
-
These panels are meant to identify transactions that stand out: they either produce many issues or have had recent changes (positive or negative) in their performance. In my experience, this data is pretty noisy, as it’s influenced more by spikes in activity or downtime than actual trends.
-
These panels allow you to choose three of several metrics to monitor. These metrics appear all over the Sentry Performance interface, so it’s best to become familiar with them:
- p50/p75/p95/p99 Duration all give you the time under which a percentile of transactions finish. This data can be useful when filtering on a few related transactions, but it’s pretty meaningless when looking at all your API calls for example, as transaction times will vary wildly between different types of transactions.
- Apdex is a standard measure of user satisfaction. It’s computed as a weighted average of satisfied and frustrated users, using a pre-defined response time threshold that you can modify in your project settings. In the end, you get a score out of 1; the smaller your score is, the bigger proportion of your users are frustrated with the performance of your app.
- User Misery is a custom, Sentry-made metric. It’s similar to Apdex, but it’s meant to emphasize the impact on users. Two transactions with the same Apdex will have different User Misery scores depending on their total number of occurrences. This makes sense, but the exact formula behind the metric is unclear, so in my experience, it’s less actionable than Apdex. Mind that it should be read as the opposite of Apdex: the bigger the User Misery, the worse your users’ experience!
- Failure Rate is a pretty straightforward metric that records how often transactions aren’t successful. This is more about reliability than performance, but it’s pretty damn important! A high failure rate should definitely catch your attention.
- Transactions Per Minute (TPM) represents the throughput of your application. A higher throughput than normal is not an issue in itself, but it’s interesting to correlate it with other metrics to identify if a higher load is causing issues in your app.
There are also other metrics, like First and Largest Contentful Paint, that you can monitor in the Web Vitals tab.
-
This table contains all the transactions recorded by Sentry: API routes, frontend pages, cron jobs, you name it. You can sort them by several of the metrics above, as well as by the number of unique users. This table is exceptionally useful if you want to prioritize your performance-related efforts and figure out exactly what performance issues are impacting your users the most.
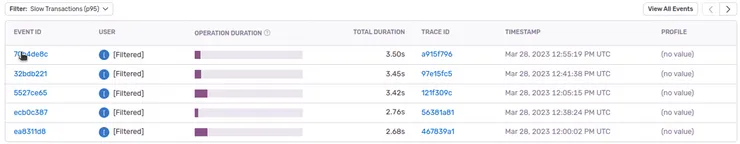
You can click on a specific transaction and get more detailed information about it:
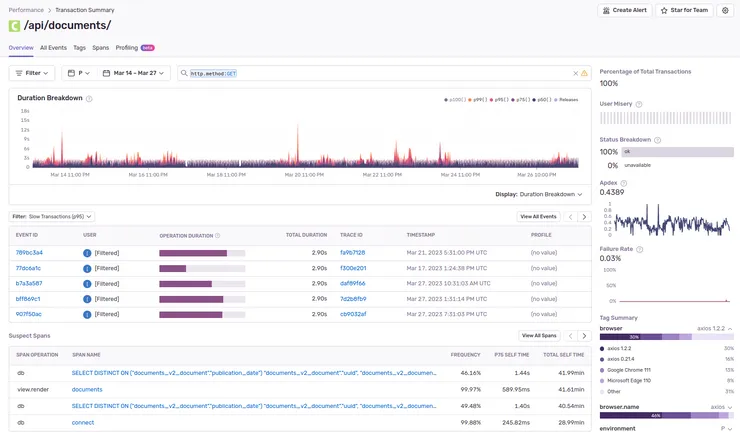
You’ll find all the metrics mentioned above in greater detail, along with a list of the slowest occurrences of that transaction. This can allow you to dig deeper into the outlier events and understand if some edge cases are hurting your performance.
Define alerts to be notified when your performance is not up to standard
While all of this information is great, you don’t wanna have to check it manually all the time. Thankfully, you can set up Sentry to alert you when a performance metric is degraded. You might already have configured alerts to be notified when bugs pop up in production; the process is quite similar to setting up performance alerting.
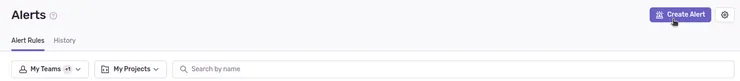
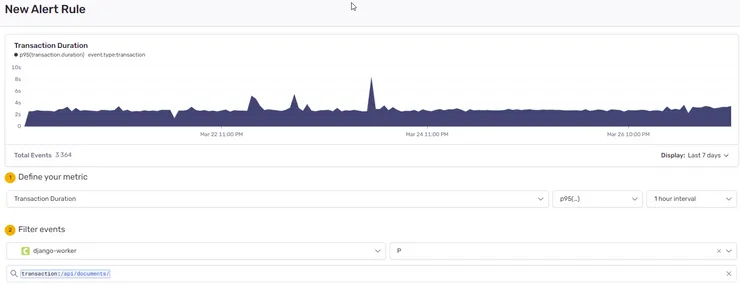
Head to the Alerts tab, and click Create Alert:
You can pick between several metrics to be alerted about. Your choice will depend on your project needs: you can monitor frontend performance through Core Web Vitals like Largest Contentful Paint or First Input Delay, application load with Throughput, or API performance with Transaction Duration. For this example, we’ll set up an alert on a crucial API route:
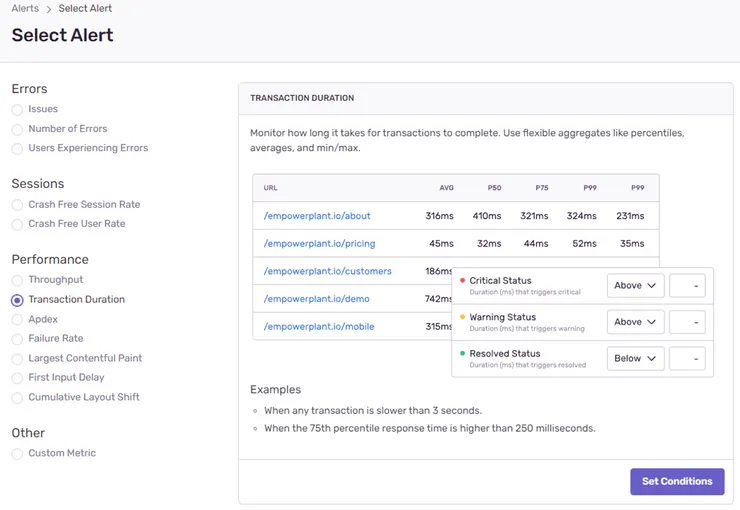
We’ll filter events to monitor a single type of transaction, only in production. You can fiddle with the percentile and time interval to better fit your needs: for example, a higher time interval means you get alerted earlier, but your data will be noisier.
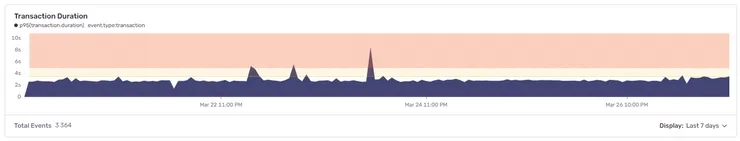
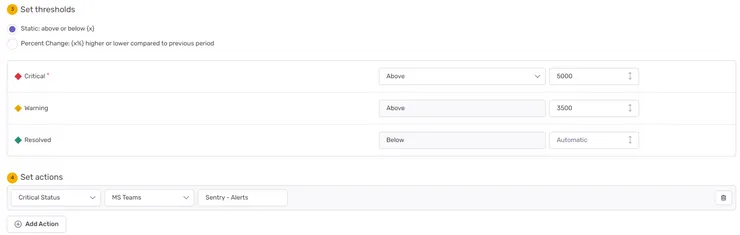
Then, we define thresholds for warnings and critical alerts. Again, this highly depends on your needs. Critical API routes might be expected to run under 500ms, while background jobs will have more leeway. You can use the graph Sentry provides you to pick sensible thresholds; here we’ll start issuing warnings above 3500ms and critical alerts above 5000ms.
 Obviously, we want to be notified when alerts go off, so let’s not forget to add Actions related to our alert. This works exactly the same as for issues: you can pick your alerting feed of choice (Slack, emails, Teams…)
Name the rule and save it: we’re all set up! Now if our users start experiencing slow downs on this route, we’ll know right away.
Analyze traces to understand how to improve performance
Let’s say that, a week later, the alert pops up in your Slack feed. What to do? Well, the good news is, Sentry is here to help once again.
First, check if this is a general issue. The Performance tab can help you with that: is Throughput increasing on your app? What about Failure Rate? This alert could be a symptom of a greater issue.
If not, then it’s time to dig deeper into this specific transaction! I’ll give you an example from a project we developed at Theodo using Django. A critical API for retrieving user documents got slower after we added some information on the document model. So after being notified by Sentry, I headed to Sentry to investigate that API route.
I got to the transaction page and looked at one of the slower and more recent events.
Take a look at the trace for that event:
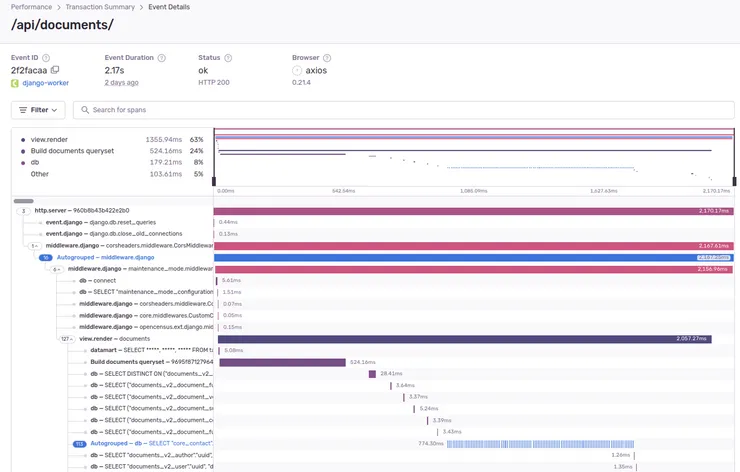
Traces are incredibly powerful! They help you make sense of what happened in a transaction. They’re made up of spans, smaller units of execution. By default, Sentry creates spans when you make database queries or HTTP calls, but you can define your own spans inside your code. For example, notice the “Build documents queryset” in the screenshot above. We defined it ourselves when noticing it took a significant time in this transaction. In Python, this is done by wrapping the relevant code in a context manager:
import sentry_sdk

with sentry_sdk.start_span(op="Your span name"):
		your_code()
Operations that are not wrapped in a span will appear as grey areas in the trace.
But the interesting part of that trace is the “Autogrouped” database queries. That means more than 100 almost identical database queries were made. This is a telltale sign of an N+1 query. Check out this article on N+1 queries if you want to learn more about them. In our case, when we fetch documents, we then fetch the contacts for each document separately, resulting in a number of extra queries equal to the number of documents.
We didn’t intend for this, and it wasn’t easy to spot because we are using the Django ORM and serializers, so all those queries were hidden away from us. This piece of code was the culprit:
from django.db import models
from django.contrib.auth.models import User
from rest_framework.serializers import ModelSerializer

from models import Contact, ContactSerializer

class Document(models.Model):
		user = models.ForeignKey(User, on_delete=models.CASCADE)
		name = models.CharField()
		contacts = models.ManyToManyField(
			to=Contact,
			blank=True,
			related_name="contacts"
		)

class DocumentSerializer(ModelSerializer):
		class Meta:
				model = Document
				fields = ["uuid", "name", "contacts"]

		contacts = ContactSerializer(many=True)

def get_documents(user):
		documents_queryset = Document.objects.filter(user=user)
		return DocumentSerializer(documents_queryset, many=True)
If you don’t know much about Django, don’t get confused. All that is happening is we’re fetching and serializing the documents to return them from the API. The N+1 query is actually hidden inside the serializer! When we add the “contacts” field to the serializer, it tells Django to fetch the contacts for each document it serializes.
There’s thankfully an easy fix to this available in Django: we can pre-fetch the contacts before serializing the documents, simply by adding a prefetch_related call to the queryset:
def get_documents(user):
		documents_queryset =
				Document.objects.filter(user=user).prefetch_related("contacts")
		return DocumentSerializer(documents_queryset, many=True)
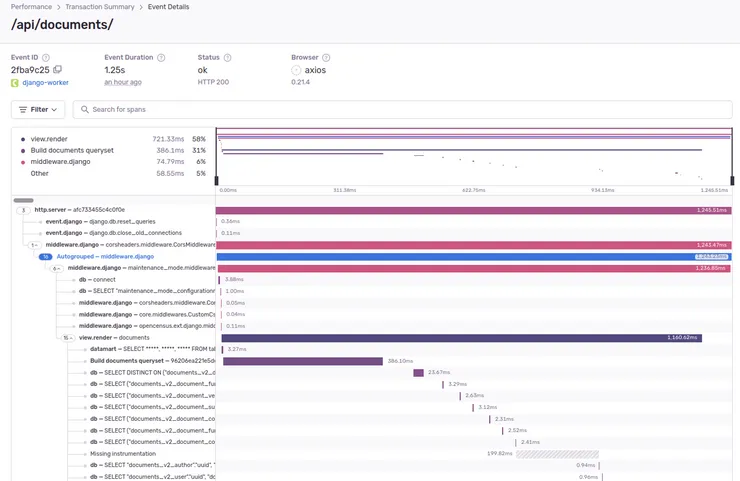
Once we implement this, the N+1 query goes away, and the route is as performant as before! If you want to prevent N+1 queries from creeping in your Django codebase even earlier, check out this article on how to detect N+1 queries in automated tests.
Conclusion
Sentry is a powerful tool for monitoring your application performance. It can help you detect performance issues early, and gives you the tools to identify the root causes of slow transactions. It offers integrations with over 100 frameworks and technologies, and both alerting and tracing can be customized to your needs. And with the profiling feature on the horizon (currently in beta), Sentry will soon be able to help you optimize your code even further!
If you’re interested in improving your Sentry issue management, check out how we leverage alerting customization at Theodo.