How to improve your monitoring and alerting on Sentry
Quentin Scabello9 min read
In February of last year, I began my first project to improve a banking application. This project had a common code base used by about 10 teams, as well as external dependencies. My team and I developed a new subscription path for users. It was crucial for our client that the application was functioning properly, in order to avoid launching a subscription with bugs.
One effective way to monitor and assess the health of our application is to use Sentry, an error-monitoring tool. When an error occurs, Sentry captures it and records information such as the type of error, when it occurred, and associated contextual data. This helps developers to quickly identify and fix errors in the application.
Upon arriving, the team and I were unfamiliar with Sentry, so we had to learn about it and get to grips with its functionality. In the following months, I focused on two main areas of improvement: grouping errors and monitoring them. In this article, I will present the various strategies and techniques I used to monitor and analyze errors, in order to ensure the stability and quality of the application.
Manual grouping to resolve common errors
When an error is sent to Sentry, a hash is calculated based on the call stack, the error message, or some data about the user. If two errors are similar, they will have the same hash and be grouped into one error to avoid duplicates and overloading our error list.
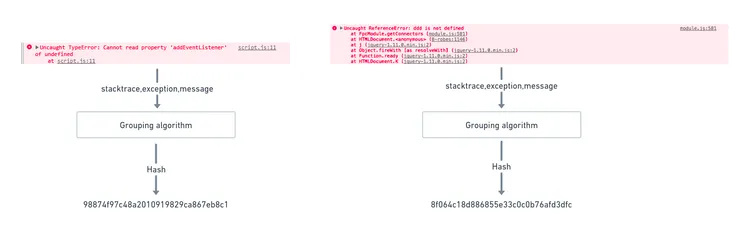
If an error returns a custom error message based on an object (DTO, entity, date, …) or if a transaction got a path
parameter, Sentry will not always group the two errors.
 However, there are three possible methods to configure Sentry to do this:
- Grouping the outcomes manually
- Add rules to group errors with similar attributes. This is relatively similar to regular expressions, but for Sentry
errors.

- We specify a fingerprint directly in the application code
We dedicated one day of our week to cleaning up our Sentry dashboard. We manually grouped errors using fingerprints, ignored irrelevant errors, and deleted errors that had already been resolved. This work allowed us to do a major cleanup of the application’s Sentry errors.
However, this grouping was done manually at a specific point in time without any particular strategy for the given errors. As a result, it will not be effective for new routes or microservices, as it does not cover all possible errors. We have estimated the number of errors in the application, and our goal is now to reduce this number by solving the most frequent errors one at a time.
Daily monitoring to improve the status of a micro-service
Initially, we aimed to briefly review each new issue originating from our micro-service to avoid missing anything. Every day, we analyzed and prioritized new errors based on their severity. To facilitate their resolution when they reappeared, we documented the steps taken to resolve them. We spent approximately 40 minutes per day on this analysis. But this system has several limitations:
- Usually, forty minutes is not enough time to properly analyze an error, understand its impact on users, and propose a fix. My application has numerous micro-services and external dependencies. While some bugs are simple to fix, other Sentry errors have persisted for months. A long-term solution often takes several hours to implement. To avoid accumulating a backlog of bugs, we need to examine and address errors on a daily basis. With debugging data available for only one month, some errors cannot be analyzed, which defeats the purpose of our monitoring.
- If our stock of errors is accumulating, we will tend to make small fixes to resolve immediately the error. It’s hard to design long-term fixes in less than an hour. If you need someone else help, it becomes mission impossible.
- This daily time spent on Sentry is not spent delivering new features. With this system, between 10 and 15% of our day was spent doing quality on the project. This is a significant portion of some projects
- This monitoring work is suitable for a micro-service. With two or three people, it is possible to monitor a micro-service and a front end. But what happens if you become the owner of 4 micro-services, and 2 of them are used by every other project teams?
These problems were unpleasant for the team, which didn’t feel it was making progress. We decided to abandon this system.
Real-time alerting on Slack
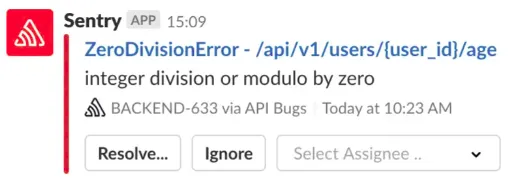
To monitor our customers’ journeys on our microservices, we use the Alerts tab in Sentry. This tool links Sentry to
Slack channels, allowing you to create alerts that send messages to specific channels. If a new error occurs, or if an
existing error occurs multiple times, a message with error details is sent to the Slack channel.
 To create an alert room with Slack
integration, Follow the Sentry documentation
to learn how to create an alert room with Slack integration,
To create an alert room with Slack
integration, Follow the Sentry documentation
to learn how to create an alert room with Slack integration,
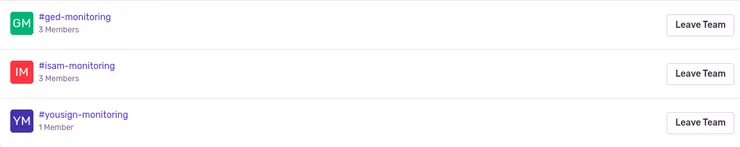
For each of our micro-services, we have created two different alerting rooms:
- an assigned channel
- an unassigned channel
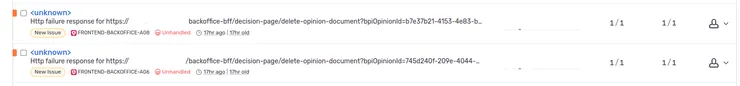
The unassigned channel contains all the errors of the micro-service. Since several teams work on certain micro-services, this channel does not filter out errors, and new ones continue to arrive in this room. Once the error is analyzed, it is assigned to one of the teams working on this micro-service. Any new occurrences of the issue will be directed to the assigned channel, which is dedicated to errors assigned to the team.
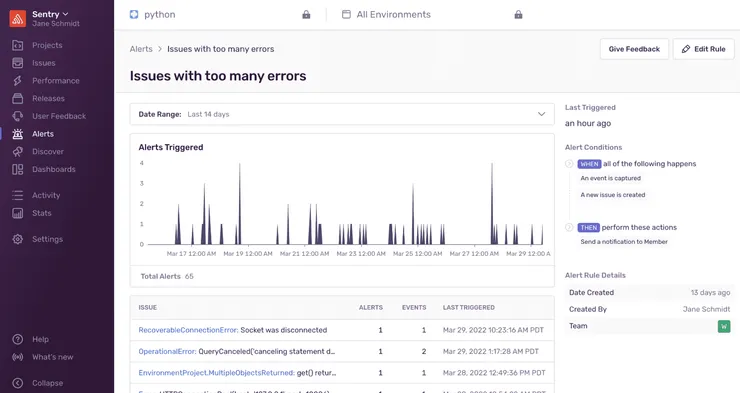
We begin by noting the number of alerts we receive each day. This helps us identify the microservices that are causing the most errors, allowing us to focus our efforts on the most critical areas. Additionally, the Sentry alerting page provides a clear view of the various alerts during a given period. This allows us to easily identify the most frequent errors, as well as any peaks that may be indicative of production incidents.
Better grouping to remove noise
The method of using Slack is rather effective in improving the reactivity to bugs. Additionally, we have already detected several bugs in production thanks to this alerting. However, the problem of error clustering still persists. Several times, we have had an error that was badly grouped, producing a lot of noise and many duplicate alerts. This problem requires more attention.
According to Sentry, there are 3 good ways to group:
- by application path
- by root cause
- by server/geographical area
In our case, grouping by server or geographical area does not make sense, as our application is mainly used in France. So the first two options remain.
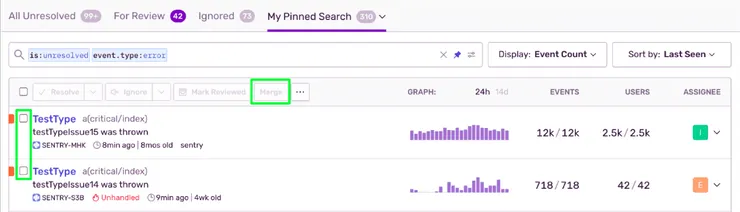
Grouping by root cause is easy to set up since Sentry naturally groups errors with the same root cause. This is because the fingerprint is calculated from the error message and the stack trace. We can also create rules to group errors by transaction or error message similarity. Therefore, I began grouping errors by transaction and error message for easier management.
However, it is essential to have a comprehensive understanding of the entire application. Many transactions that appear dissimilar at first glance may actually point to the same root cause. To group issues together, rules can be added to error messages, but if the error message changes, the grouping may break.
Sentry has a feature that suggests which people or team should be responsible for an error based on the commit that introduced it. This feature is very handy because it can save a lot of time. When working on a shared front end with other teams, this feature eliminates the need to assign errors between teams. Instead, we can focus on solving errors, without being bothered by errors that do not concern us.
However, there are two problems:
- By self-assigning, we lose the notion of a new error. It’s complex to tell the difference between new and existing errors.
- To find the suspect commit, Sentry looks at the most recent commit in the first file in the error trace stack. This method is not reliable because it is not always the most recent commit which introduced the error.
Increase responsiveness and efficiency by monitoring critical paths in a micro-service
After further grouping by root cause, it was discovered that an error was producing a lot of noise, making it difficult to see errors on crucial routes. To separate these noise-producing errors from the other more critical errors, several methods can be used:
-
Ignore the error on Sentry
-
Create other alerts specific to the route you want to monitor
-
Use filters on the alerts to remove the noisy error We decided to use a mixture of the first two solutions. As noisy errors are generally from external libraries, they can often be ignored. To create specific alerting channels on specific routes, we created different dummy teams on Sentry.
We assign all errors related to the noisy route to a team dedicated to handling these errors. We create a dedicated alerting channel on Slack for this team and set up a condition to recover any errors assigned to them. Additionally, we assign any new errors arriving at the unassigned alerting channel of the micro-service to the appropriate teams to ensure they are directed to the correct alerting channels.
Conclusion
Over the past 12 months, two distinct systems have been tested and implemented to monitor and process new errors on Sentry:
- A manual method, where each day the team looks at and assigns new errors. This method ensures that nothing is missed, but was not suitable for the size and complexity of the project.
- A more automated method using Slack channels and Sentry alerting. This method is more expensive to set up, but ultimately, allows for structured and efficient monitoring. In the last month, we have solved 9 bugs thanks to Sentry before being reported by users.
There are still a few areas for improvement in this last method:
- Using stack trace grouping to remove noise-producing errors, instead of having a constantly polluted Slack unassigned channel. Some front-end libraries produce a lot of noise which is quite unreadable.
- Ignoring Sentry errors is effective, but there is always a risk of missing an error. Adding extra information to the error traces could reduce this margin of error.