Flask Debugging in VS Code with Hot-Reload 🔥
Adrien Cacciaguerra8 min read
I love using a debugger when I code. It allows me to quickly understand why something does not work as intended, but also to get a faster and deeper understanding of code I did not write.
Since I am so fond of using a debugger, when I started working on a Dockerized Flask application, my first online search was to find how to set one up for my application. But all the solutions I found had different flaws:
- ❌ The application port would be changed every time I started the application with the debugger
- ❌ Flask’s wonderful hot-reload feature (the server restarting after saving changes to the code) was not supported
- ❌ The usage was clunky. To make the debugger work, I had to consistently add then remove multiple lines of work
So, I decided to craft my own debugger setup to fix all those problems.
Let’s see how to setup a Dockerized Flask app with an efficient debugging flow 🎉!
🔧 Prerequisites
To follow this tutorial, you will only need the following installed:
- VS Code
- Docker
- Docker Compose
- The VS Code Python extension
Step 1: Docker setup
To follow this tutorial, make sure you have a Docker configuration similar to this:
# docker-compose.yml
version: "3.4"

services:
  flask-server:
    image: flask
    build:
      context: .
      dockerfile: Dockerfile
    ports:
      - 5000:5000
    volumes:
      - .:/app:cached
# Dockerfile
FROM python:3.8

EXPOSE 5000

# Keeps Python from generating .pyc files in the container
ENV PYTHONDONTWRITEBYTECODE 1

# Turns off buffering for easier container logging
ENV PYTHONUNBUFFERED 1

# Install pip requirements
ADD requirements.txt .
RUN python -m pip install -r requirements.txt

WORKDIR /app

# Switch to a non-root user, please refer to https://aka.ms/vscode-docker-python-user-rights
RUN useradd appuser && chown -R appuser /app
USER appuser
Here we have setup a simple flask-server service that will run our Flask application inside a Docker container.
Step 2: Setup the debugger
VS Code configuration
The only configuration you will need is adding or modifying the .vscode/launch.json file:
// .vscode/launch.json
{
  "configurations": [
    {
      "name": "Python: Remote Attach",
      "type": "python",
      "request": "attach",
      "port": 10001,
      "host": "localhost",
      "pathMappings": [
        {
          "localRoot": "${workspaceFolder}",
          "remoteRoot": "/app"
        }
      ]
    }
  ]
}
-
Be sure to properly setup the
pathMappingsproperty. This will be used to link the files being executed in the Docker container to the files in your machine. -
The
.vscodefolder stores all the project's VS Code configuration files.
Install the debugpy Python module
debugpy is a Python module that will allow you
to spawn a debugger inside our Python code.
To install it, make sure to add debugpy to your requirements.txt:
flask==1.1.2
+debugpy
debugpy==1.0.0) will automatically install the latest version of the module.
Use debugpy to create a debug adapter instance
Create a debugger.py file in your application:
# debugger.py
from os import getenv

def initialize_flask_server_debugger_if_needed():
    if getenv("DEBUGGER") == "True":
        import multiprocessing

        if multiprocessing.current_process().pid > 1:
            import debugpy

            debugpy.listen(("0.0.0.0", 10001))
            print("⏳ VS Code debugger can now be attached, press F5 in VS Code ⏳", flush=True)
            debugpy.wait_for_client()
            print("🎉 VS Code debugger attached, enjoy debugging 🎉", flush=True)
Let’s explain what is happening here:
Debug adapter logic
debugpy.listen(("0.0.0.0", 10001))
This will start the debug adapter that will listen for a client connection at the 0.0.0.0:10001 interface.
debugpy.wait_for_client()
This line will block program execution until a client (in our case, the client will be the VS Code debugger) is attached.
More logic for a better experience
if getenv("DEBUGGER") == "True":
We want the debugger to be spawned only if the DEBUGGER env variable is set to True.
That way, we will still be able to run our application without it.
if multiprocessing.current_process().pid > 1:
In debug mode Flask uses a first process (with pid==1) to start child processes that handle connections.
If the code below this line is executed by the main process, the debugging port is taken and subsequent
child processes can’t use the same port and are attributed a random port which prevents connections.
Instantiate the debugger
Given that your Flask application instance app is created in a file named app.py, call the initialize_flask_server_debugger_if_needed function
inside it like this:
# app.py
from flask import Flask
from debugger import initialize_flask_server_debugger_if_needed

initialize_flask_server_debugger_if_needed()

app = Flask(__name__)

@app.route("/")
def home():
    return "Hello, Flask!"
Expose the debugging port
To be able to listen to the debug port of your Docker container, add the 10001
port to the list of exposed ports:
# docker-compose.yml
...
services:
  flask-server:
    ...
    ports:
      - 5000:5000
      - 10001:10001
    ...
Launch your application with a debugger 🎉
Everything is set up, now we only need to start our application!
Here are the docker-compose commands in a Makefile to launch your application with hot-reload using the flask executable.
# Makefile
## 🌶 flask and hot-reload
flask:
	docker-compose run --rm -e FLASK_APP=app.py -e FLASK_ENV=development --service-ports flask-server flask run --host 0.0.0.0

flaskdebug:
	docker-compose run --rm -e DEBUGGER=True -e FLASK_APP=app.py -e FLASK_ENV=development --service-ports flask-server flask run --host 0.0.0.0
The only difference between the two commands is the -e DEBUGGER=True parameter. This
will set the DEBUGGER env variable to True inside your container, allowing
the debugger code to be executed.
Here’s a GIF to show the debugger in action:
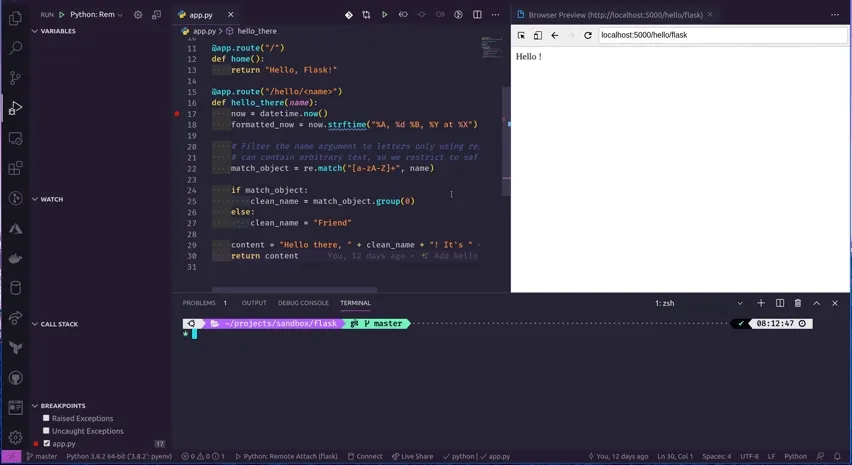
To summarize, here are the steps to follow:
- In a terminal, run
make flaskdebug - When prompted
⏳ VS Code debugger can now be attached, press F5 in VS Code ⏳, pressF5 - Add a breakpoint to the line you want to debug by clicking left of its number
- Call the corresponding route (
localhost:5000/hello/flaskin the GIF) - The debugger stops the code at your breakpoint, happy debugging 🎉
Hot-reload in action 🔥
Now that it’s easy to use the debugger, let’s see how the application hot-reload feature is supported.
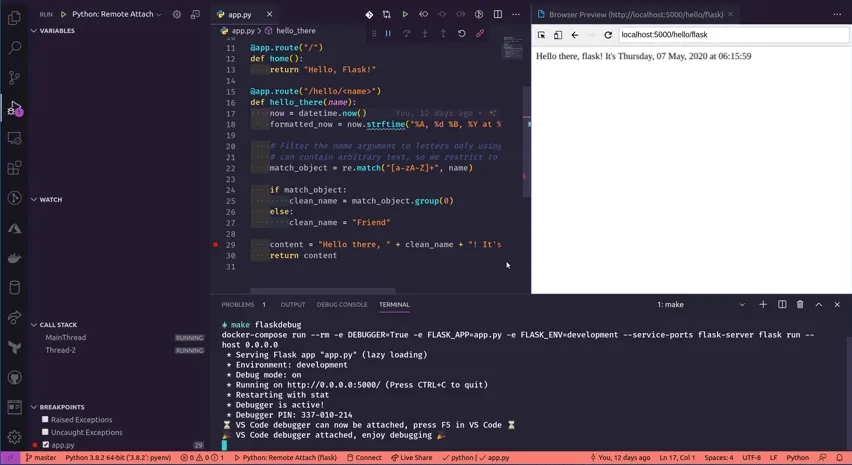
As you can see in the GIF, after I saved modifications to a file:
- The application restarts
- The debugger is detached
- I am prompted
⏳ VS Code debugger can now be attached, press F5 in VS Code ⏳again - After I pressed
F5, the application is now running with the new changes and the debugger is attached
Tips & tricks
Use the Debug Console to code on the fly
Whenever you are stopped at a breakpoint in your code, VS Code’s Debug Console acts as a Python interactive console with the full current context of your code.
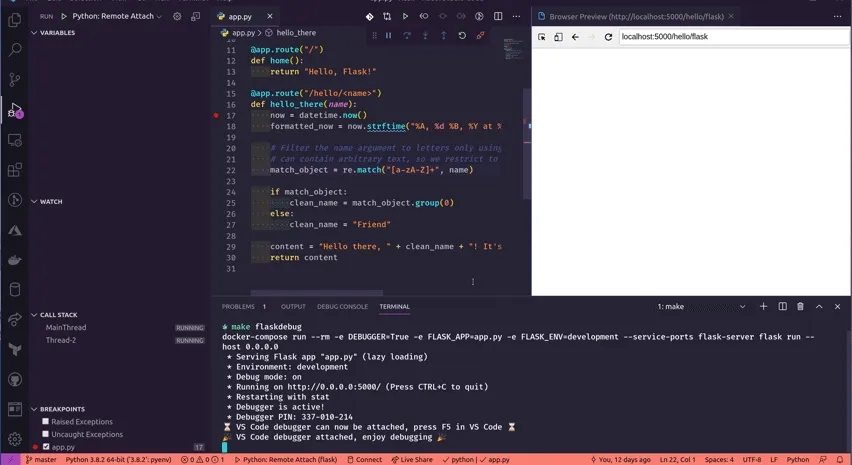
Here you can see that I was able to do the following:
- Import
datefrom thedatetimemodule - Re-assign the
namevalue todate(3000, 1, 1) - The route response is correctly updated with the modifications
Debug Console is a very useful tool to quickly test edge cases and find fixes!
Running the app with gunicorn
To use gunicorn instead of flask to run the app, use these commands:
## 🦄 gunicorn and hot-reload
gunicorn:
	docker-compose run --rm --service-ports flask-server gunicorn --reload --bind 0.0.0.0:5000 app:app

gunicorndebug:
	docker-compose run --rm -e DEBUGGER=True --service-ports flask-server gunicorn --reload --bind 0.0.0.0:5000 --timeout 3600 app:app
Running the app as a top-level script
If you need to run your app as a top-level script, ie:
- The app is run with
python app.py -
# app.py
...
if __name__ == "__main__":
    app.run("0.0.0.0", debug=True)
Be sure to make this modification:
if __name__ == "__main__":
    from debugger import initialize_flask_server_debugger_if_needed

    initialize_flask_server_debugger_if_needed()

    app.run("0.0.0.0", debug=True)
Thanks to this, if you want to use the app instance in another file:
# another-python-file.py
from app import app
The code initiating the debugger will not be executed when the import is made.
Wrap-up 🌯
I showed you how to resolve the three problems presented I encountered trying to setup a debugging flow in a Dockerized Flask application:
- ✔️ The application port does not change
- ✔️ Flask’s wonderful hot-reload feature is supported
- ✔️ The debugger is easy to use
I created a repository containing a minimal application with everything shown in the article.
I hope that this article helped you setup a (better!) debugging flow of your Dockerized Flask application 💪.
- 📧 by email
- 🐦 on twitter
- 🐙 by leaving an issue or a pull request on the tutorial repository
- 💬 by leaving a comment below