Measure the server-side impact of your application with PowerAPI
Cyrielle Willerval9 min read

According to a report made by The Shift Project, the carbon footprint of the digital is estimated to exceed air travel with more than 4% of the total greenhouse gas emissions. This number is expected to double in the next five years!
Green IT principles aims to reduce the impact of the digital. As a developer, I wondered how these principles could be used for the web applications I worked on, and what could be improved.
I first looked at the definition of digital. It includes:
- Networks (for instance wifi and 4G)
- Data centers (used to host the servers and the data)
- Terminals (smartphones, computers, TVs)
- IoT (connected objects like a home assistant or a smart thermostat)
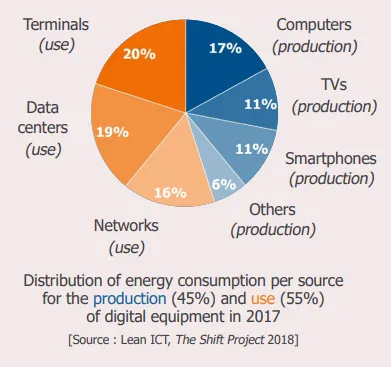
In this chart, the Shift Project shows that the energy consumption can be divided in two factors:
- 45% of the total emissions is dedicated to the production of digital equipment. To reduce the carbon footprint, it is important to keep a computer or a smartphone as long as possible. However, the average lifespan of a computer is estimated around 2 years. As developers, we can have an influence on the lifespan of our users’ devices by making sure our applications are not too slow on old devices. Indeed, when you need 30 seconds to open most websites, your first thought usually is: “I really need to change my phone”!
- 55% of the emissions come from the usage of the equipment. We can have an impact on this energy consumption by designing sober and low-consuming applications.
So how can we measure the impact of a web application on our user’s device?
- Some websites like Website Carbon ou EcoIndex (for french users) can estimate the client-side carbon footprint of a web application.
- There is also the 1-byte-model which estimates the global carbon footprint. It takes into account the energy consumption of the data center, the network and the user device. A browser extension exists to see the impact of a website.
The data centers represents 19% of the digital energy consumption and some improvements in efficiency and performance can be found. However, there is no easy way to measure the carbon footprint of the server-side of an application. Therefore, it is complex to know where to begin to reduce the impact!
Example of a web application
At Theodo, we use an internal application to display the developers’ current missions and availabilities. It is used by the sale representatives to see which developers are available and to staff them on new projects. One person has access to a CSV file online, and updates it several times a day. It is important to always have up-to-date data on the application in order to correctly staff the developers.
To update the application database, a script runs every 15 minutes: it imports the CSV file and parses it, then modifies the availability of the developers in the database. The file, which is quite large, is therefore imported 96 times a day. I had the intuition that it was consuming a lot of energy to run this script as many times, and I looked for a way to confirm or deny it.
I searched “How can I measure my server energy consumption” online and found out that simplest way was to plug a wattmeter into my computer, run the script locally and monitor the energy consumption. However, like most people, I don’t have a wattmeter at home, and I was not very keen on buying one for this unique usage.
I finally discovered a very useful tool: PowerAPI.
PowerAPI
PowerAPI is an open-source project developed by the Spirals research group (University of Lille 1 and Inria) in order to estimate the power consumption of a software, without any external device like a wattmeter. The calculation is made based on the analysis of the consumption of various hardware components (for instance CPU, memory, disk…). The objective is simple: design less energy-consuming software by easily monitoring their power consumption.
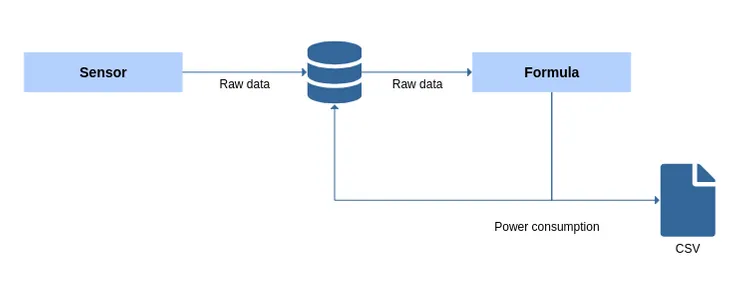
The power meter created by PowerAPI is composed of two components: the sensor and the formula
- the sensor collects raw data from the hardware while the software is executed and stores it in a database.
- the formula accesses this database, processes the raw data into a power consumption in Watt. The formula can store the results in the database or export it in a CSV.
As the sensor needs information from the Linux kernel, PowerAPI can only be used on Linux machines and not on a virtual machine.
Install PowerAPI
To install PowerAPI, you need:
- Docker installed on your machine
- a MongoDB database that can be accessed by your machine.
In my case, I decided to execute the project locally and deploy the MongoDB instance on my computer.
In the MongoDB database, I created a database (I decided to call it power-data) and two collections:
- a collection to store the raw data from the sensor (in my example
sensor-data) - a collection to store the computed results from the formula (
formula-data)
You can either monitor the global power consumption of your machine, or monitor the power consumption of all Docker containers. As my project was using Vagrant, I decided to monitor the global power consumption of my computer. However, I recommend monitoring the Docker containers as it will reduce the “noise” created by your machine.
To install PowerAPI, the PowerAPI documentation will guide you. Once the MongoDB instance is created, the power meter can be deployed in two commands and a few minutes. Here’s a rapid recap, to measure the global power consumption:
- Deploy the sensor: launch the first command to create the sensor Docker container.
docker run --privileged --net=host --name powerapi-sensor --privileged -td \
           -v /sys:/sys \
                   -v /var/lib/docker/containers:/var/lib/docker/containers:ro \
                   -v /tmp/powerapi-sensor-reporting:/reporting powerapi/hwpc-sensor \
                   -n powerapi-sensor \
                   -r "mongodb" -U "mongodb://ADDR" -D "power-data" -C "sensor-data" \
                   -s "rapl" -o -e RAPL_ENERGY_PKG
- Deploy the formula: launch the second command to create the formula Docker container.
docker run -td --net=host --name powerapi-formula powerapi/rapl-formula \
          -s \
          --input mongodb -u mongodb://ADDR -d power-data -c sensor-data \
          --output mongodb -u mongodb://ADDR -d power-data -c formula-data
The power meter is now ready, with two running Docker containers: the sensor and the formula.
Start measuring

If both Dockers are running, the power estimation is stored in the database. To stop monitoring, stop the Dockers.
The results
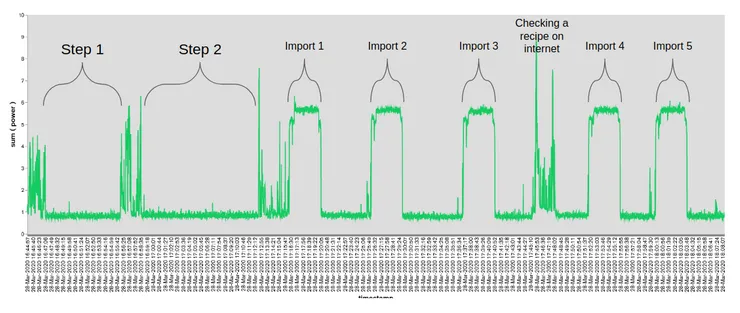
Once PowerAPI was deployed:
- Step 1: I first started to monitor my computer energy consumption, to estimate what was the “noise” created by my machine.
- Step 2: I launched the vagrant to start my application
- Step 3: I ran the script 5 times in order to get average data.
The formula had stored all my power consumption data in the database. Now, I needed a way to display and analyse it.
How to process data from PowerAPI
First, I decided to use MongoDB Charts to display my results.
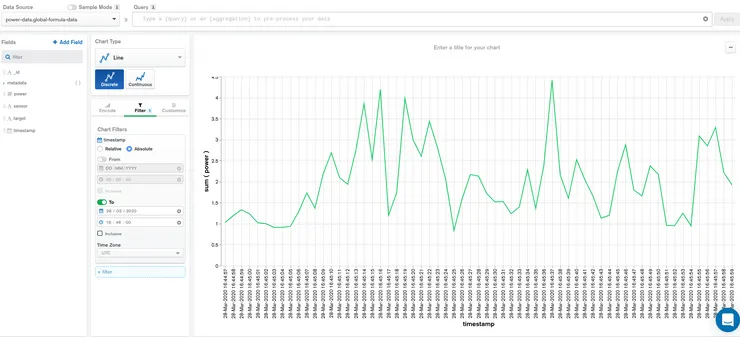
MongoDB provided me a simple interface to display the results written by the formula. I can for instance filter by date, to create a graph for a precise duration. On this chart, I displayed the energy consumption of my application during 1 minute.
However, in order to extract more information from the results, I decided to extract the data as a CSV, which can be done:
- directly in the formula parameters by adding
--output csvat the end of the command to launch the formula Docker - with a MongoDB command
- via MongoDB Charts.
Once I had the data, I started to analyze it.
The results were given in Watts. When dealing with electric consumption, it is easier to use Watt-hours: for instance, you need 1 kWh to bake a cake in an oven during 1 hour. It means that your oven consumed 1000 Watts during 1 hour.
| Duration (s) | Average Power (W) | Consumption (Wh) | |
|---|---|---|---|
| Step 1 | 225.5 | 0.81 | 0.05 |
| Step 2 | 225.5 | 0.83 | 0.05 |
| Import | 225.5 | 5.47 | 0.34 |
The import lasted in average 225.5 seconds, about 3min45.
- In Step 1, my computer alone consumed on average 0.81 W, i.e. 0.05 Wh during the imports.
- In Step 2, my computer with the vagrant containing the application running used 0.83 W. Step 1 and Step 2 are almost equivalent in terms of Wh. In other words, running the application on Vagrant does not consume of lot of energy.
- On average, one import used 0.34 Wh. The electric consumption almost did not vary between imports.
If I subtract the noise of the computer, an import alone consumes 0.29Wh. Imports are made 96 times a day, i.e. 35 064 times a year. It means the imports use each year around 10 kWh.
A Danish association, Tomorrow, created an interactive map to see in real time the countries’ electricity production and its impact in terms of CO2. Based on this website and on an 24-hours average, in France, 10 kWh corresponds to 3.5 kg of CO2 emitted, as our energy comes mostly from nuclear. In the United States, 10 kWh corresponds to 11 kg CO2.
If the server running my application was behaving exactly like my computer, it would use around 7 kWh a year.
To sum up, I estimated that the application was using 17 kWh each year, and 60% of this energy consumption is made by the imports. The rest is the energy consumes by the server, in the hypothesis of a physical server.
What can we usually do with 17 kWh? With 17 kWh, you can use your air-conditioning for 102 hours, cook 17 chickens in your oven or travel 8.5 km with a small electric car.
It is quite a lot for the server of a small web application.
What can be done to reduce the impact of this application?
I spoke with the developer and the person which was updating the CSV file, and we decided to:
- take a quick action and rapidly stop importing the file outside work hours. Importing the file only between 9a.m. and 7p.m. on weekdays reduces the total consumption of the imports to 3 kWh a year, in other words a reduction of 41% of the electric consumption!
- in the long term, create a button in the application, which can only be seen by the person updating the CSV file. He would use it when he updates the file, a few times a day. It will reduce the emissions of 95%.
What about the cloud?
Thanks to PowerAPI, I was able to estimate the impact of a costly feature on a physical server. I provided figures to help the project team make decisions to reduce the carbon footprint of the application.
However, this server runs on AWS, and PowerAPI cannot be used in a virtual environment in the cloud. In order to estimate the real impact, we need to find a methodology, using data from the cloud provider: for instance the amount of CPU used by the application.
I will try to see the real impact in the cloud of this feature in an upcoming article!