Visualising your bundle size in Expo Router apps
Mo Khazali5 min read

TLDR
- Run
npx expo export -p web --dump-sourcemapin your project. This will create adistdirectory with your exported project along with the sourcemaps. - Run
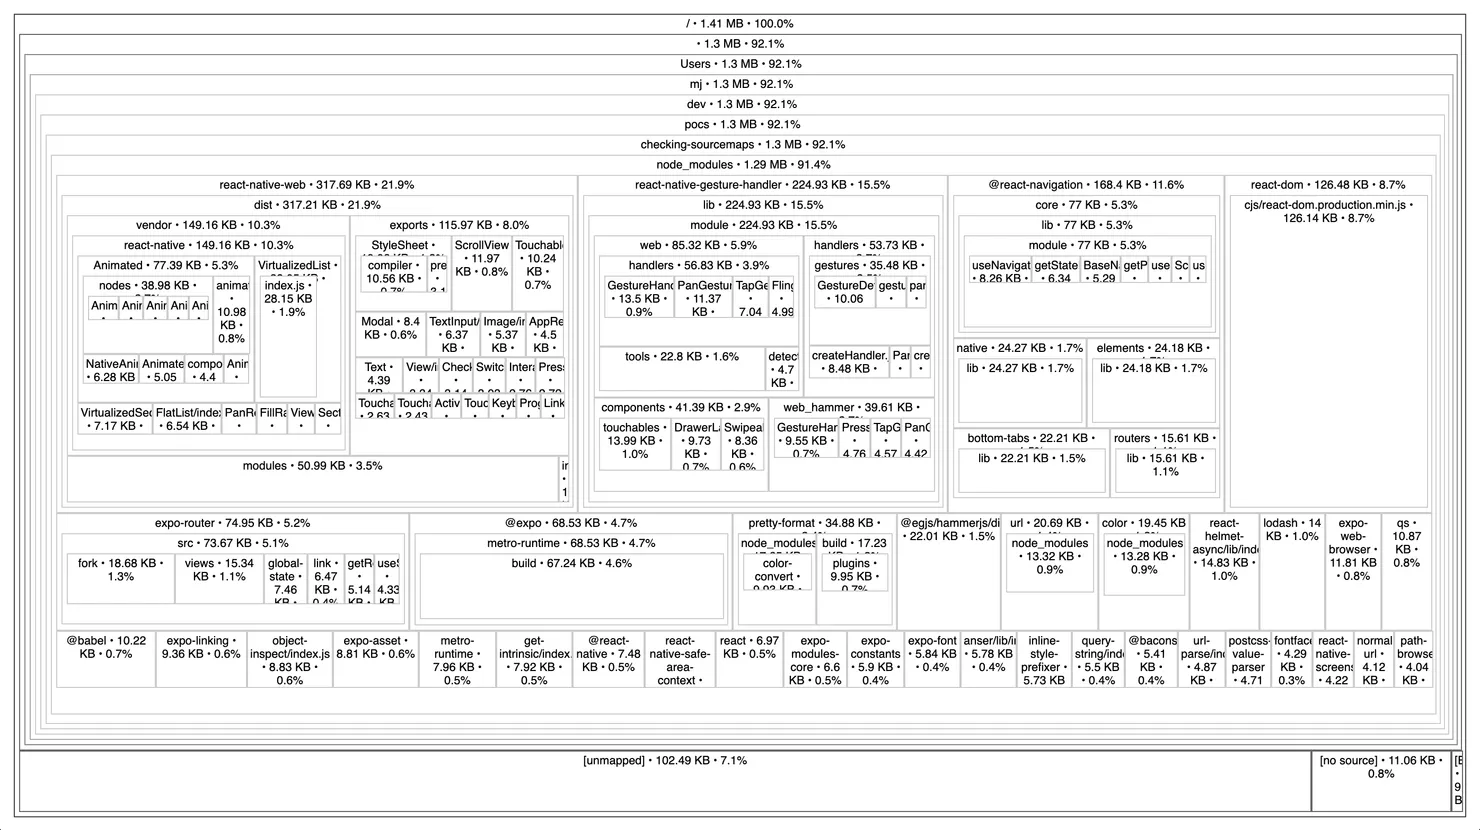
npx source-map-explorer dist/**/*.jsto get the graphic representation of your sourcemaps.
Before the days of Hermes, a major concern when productionalising React Native apps was around the JS bundle size. If apps were shipping massive amounts of JS, the JSC engine would need to load all of the Javascript before it could even start running the app. This meant that (especially on slow Android devices) app start times could be really poor.
As Hermes became more and more commonly used in apps, this became less of a pressing issue. For example, Alexandre Moreaux from our team in France found a 10-second drop in startup time in one of the apps we were working on.
Nowadays, with Metro being used to bundle for the web (especially with the Expo ecosystem & Expo Router), keeping your bundle size small has become a necessity again - especially when building a universal app.
As of Expo SDK 49, the base bundle size for a fresh new Expo Router project is ~1.4mb, which compressed with gzip comes out to just under 400KB.
Metro’s lack of tree-shaking and code-splitting support (which is coming as part of Expo SDK 50) means that we need to be super careful about what we bundle in (especially for production apps).
The first point of call with investigations is analysing the sourcemap and seeing what Javascript is being bundled into your application.
What is a sourcemap?
A sourcemap is a file that gives us a mapping between the original source code of our JavaScript files and the corresponding code in the bundled or minified output. When you bundle or minify your JavaScript code, it can become challenging to trace errors or debug the code in its compressed form. Sourcemaps provide a reference between the original, human-readable code and the optimised, minified production bundles. Even though the mapping is mainly used to debug and analyze the source code, when you’re debugging production code for bugs, it’s also a great tool for optimising your production bundle size. This will help lower your initial loading times, which will increase your app’s performance.
How does the sourcemap visualizer work?
Most sourcemap visualizers out there are more or less the same (and most use the source-map-explorer library under the hood). These tools help visualize and analyze the sizes of individual modules in your JavaScript bundle, using your source maps. They parse the source map associated with your compiled bundle and then map the information back to the original source files.
Roughly speaking these tools go through the following steps:
- Extract information about the original source files, the corresponding lines and columns in the generated code, and the mapping between them.
- Analyse the generated code and identify different modules that make up the bundle.
- For each module, calculate the size by examining the number of lines and characters associated with that module in the generated code.
- The calculated sizes are then mapped back to the original source files using the information from the source map.
- Lastly, generating a visual representation of the module sizes, either in a treemap (interactive HTML page), JSON, or TSV file.
Can’t we just use react-native-bundle-visualizer?
There’s already a react-native-bundle-visualizer package that you can run with npx inside RN apps to get a visualization of your bundle. This is also mentioned in the Expo docs.
Unfortunately, this package is built with bare RN projects in mind, and only supports iOS & Android bundles, which means it won’t work correctly with Expo Router as it tries to run a react-native bundle command.
You’ll see an error along the lines of:
Error: The resource `expo-router/entry` was not found
How to get sourcemaps & visualization with Expo Router?
This is quite simple to get working - we’ll need to handle the bundling and generation of the sourcemaps ourselves, and directly pass it through the source-map-explorer CLI.
Here are the steps to get it working:
- Run
npx expo export -p web --dump-sourcemapin your project. This will create adistdirectory with your exported project along with the sourcemaps. - Run
npx source-map-explorer dist/**/*.jsto get the graphic representation of your sourcemaps.
And voila! 🎉

Extra: why do my bundle sizes differ on Chrome from the visualization?
Something to keep in mind is that your bundle sizes that will be served by an HTTP server will be compressed so that there’s less data being transferred over the network. CDNs (such as Cloudflare) will also run some level of compression as well, using either gzip or brotli to make your network payloads as small as possible.
As an example, the sourcemap visualization shows the blank Expo Router template to be 1.4MB, whereas when you look at the size of the bundle in the network tab, it shows up as 380kb .

You can check the response headers to see what compression method is being used when serving your bundle:

What now?
We recently worked on a universal app for a streaming platform using Expo Router. It was a large-scale project that involved a lot of different features and had a team of over 12 engineers working on it at the same time.
Before going to prod, we diverted our attention to optimising the bundle size, and had some interesting learnings that I’ll be sharing in a follow up blog article. 🙂
Feel free to reach out
Feel free to reach out to me on Twitter @mo__javad. 🙂


