SheetJs: Programmatically generating stylish Excel documents
Kyle Ki11 min read

SheetJs is a javascript library that is used to create and format Excel documents. It is a powerful tool that boasts a consistent weekly download rate of over one million as well as having a dedicated team to battle issues and improve features.
SheetJs was the perfect tool to use on a recent project where we needed to serve data as a readable, formatted Excel document. The data we received was in the form of a JSON object and we were tasked with transforming that data so that it could be easily read and used in calculations. Although the documentation for the methods in SheetJs is extensive, I felt that it is lacking examples of more complete use cases.
xlsx-js-style
At the time of writing this post, SheetJs is by far the most popular library for manipulating and generating Excel documents in Node.js. The community version (listed as xlsx in the npm registry) offers a wide range of functionality for manipulating data but the formatting functionality is locked behind the pro version. The following example uses the xlsx-js-style library, a fork of the SheetJs library that includes more styling options.
Example use case
For the purpose of this blog post, I’ll highlight a simple scenario and step through it piece by piece until we have generated a satisfactory Excel file. Let’s say a client wants us to create an Excel file based on data from fundraising events where people shoot basketballs for charity. Their requirements are as follows:
- The Excel sheet is easily readable
- The number of individuals in the data can vary
- The number of attempts per individual can vary (one attempt or two attempts)
- There should be total and average columns
Based on the requirements, let’s say we want the contents of the Excel file to look something like the example below.
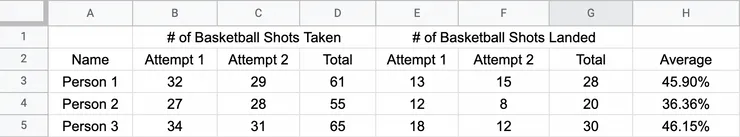
In this example, we are populating the file with the amount of basketball shots taken and landed by several people. It contains two headers with some merged cells, a “Total” and “Average” column with a formula, and several other formatting properties.
Project setup
Install the package using the following npm command.
npm install xlsx-js-style
The first thing we should do after importing the package is to create a new workbook and worksheet. The workbook is the Excel file as a whole and the worksheet is a single spreadsheet within the Excel file.
import XLSX from "xlsx-js-style";

const workbook = XLSX.utils.book_new();
const worksheet = XLSX.utils.json_to_sheet([]);

// Logic for manipulating worksheet

XLSX.utils.book_append_sheet(workbook, worksheet, "sheet_name_here");
In the code above, we create a new worksheet and append it to the book at a later time. json_to_sheet() is a method that appends data in the form of an array of json objects to a new worksheet, but in the event that an empty array in provided, it will just return a new empty worksheet.
Use a template
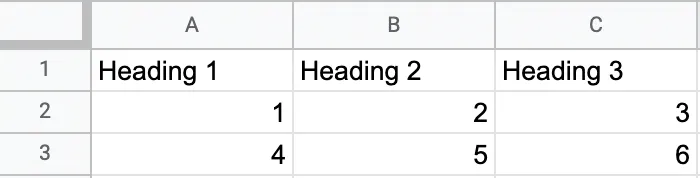
We will be utilizing the XLSX.utils.sheet_add_json() method to append data to an existing worksheet. The data needs to be in the form of an array of objects where the keys are used as headers. There is an optional parameter we can enable to prevent any headers from being created, but for now we will use the default parameters so that the headers will automatically be generated from the keys. For example, the array below will generate the following Excel sheet.
const data = [
  { "Heading 1": 1, "Heading 2": 2, "Heading 3": 3 },
  { "Heading 1": 4, "Heading 2": 5, "Heading 3": 6 },
];
It’s important to note that the order of properties in the first object will determine the order of headers. I recommend using a template to organize the data before adding it to a worksheet. I found that using a template was a simple solution to ensuring that the columns are always consistent in case the data you are using has any optional properties. It can also be useful if you want to have non-unique headers.
Creating a template will require some data pre-processing to determine what properties appear in the data. For example, if the data comes in the form of JSON then you can loop through the data and maintain a template object that records what properties have been seen.
const getTemplate = () => {
  const rawData = fetchRawData();
  // Let's say the raw data contains 3 properties
  // [{ property1: 12 },
  //  { property1: 14, property2: 1 },
  //  { property3: 42 }]
  const dataTemplate = {};
  rawData.forEach((data) => {
    Object.keys(data).forEach((propertyKey) => {
      // If property doesn't exist in template, add it with an empty value
      if (!dataTemplate[propertyKey]) dataTemplate[propertyKey] = 0; // or ''
    });
  }
  // dataTemplate = { property1: 0, property2: 0, property3: 0 }
}
However, in the fundraiser example we can just create the template manually since it is so simple.
Populating the spreadsheet
After we create the template, we can use it as a base whenever we encounter a new entity in the data.
import XLSX from "xlsx-js-style";
const template = getTemplate(); // A function like the one above that produces a template from the raw data
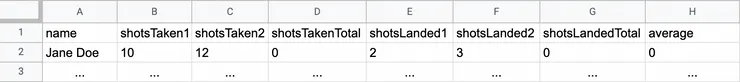
// Template example: { name: '', shotsTaken1: 0, shotsTaken2: 0, shotsTakenTotal: 0, shotsLanded1: 0, shotsLanded2: 0, shotsLandedTotal: 0, average: 0 }
const stringifiedTemplate = JSON.stringify(template);
const rawData = fetchRawData();
// [{ name: 'Jane Doe', shots_taken: { attempt1: 10, attempt2: 12 }, shots_landed: { attempt1: 2, attempt2: 3 } }, ...]
const excelData = rawData.map((data) => {
const entity = JSON.parse(template);
entity.name = data.name;
entity.shotsTaken1 = data.shots_taken.attempt1;
entity.shotsTaken2 = data.shots_taken?.attempt2 ?? 0;
entity.shotsLanded1 = data.shots_landed.attempt1;
entity.shotsLanded2 = data.shots_landed?.attempt2 ?? 0;
return entity;
});
XLSX.utils.sheet_add_json(worksheet, excelData);
We parse the template for each person we encounter in the data and then populate the existing fields with the information from the raw data. Alternatively, if the raw data comes in chunks and you need to access a person’s template multiple times, you can set excelData to an object and attach each template to a unique string ID. Then you can grab the values of excelData using Object.values() and append to the worksheet. In the example below, the data for shots taken and the data for shots landed come in as two different batches of data.
const excelData = {};

rawShotsTakenData.forEach((data) => {
  const { id } = data;
  if (!excelData[id]) {
    excelData[id] = JSON.parse(template);
  }
  excelData[id].name = data.name;
  excelData[id].shotsTaken1 = data.shots_taken.attempt1;
  excelData[id].shotsTaken2 = data.shots_taken?.attempt2 ?? 0;
});

rawShotsLandedData.forEach((data) => {
  const { id } = data;
  excelData[id].shotsLanded1 = data.shots_landed.attempt1;
  excelData[id].shotsLanded2 = data.shots_landed?.attempt2 ?? 0;
});

XLSX.utils.sheet_add_json(worksheet, Object.values(excelData));
Running one of the snippets above should result in a sheet similar to the picture below.
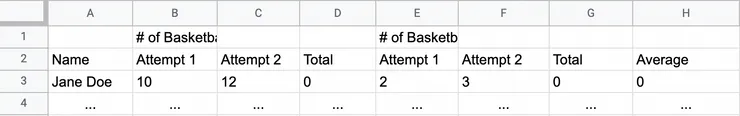
The information is in the layout we want, but the headers are not in the state we want them. We want non-unique headers, but it is impossible to have non-unique keys in a javascript object, so what can we do? Well, since we created a template, we can now ensure that the order of properties will be the same for every person and create a custom header array to add to the worksheet. Since the custom header array will be an array of strings, we will be using the XLSX.utils.sheet_add_aoa() method to add it to an existing worksheet.
While we are at it, we can also add the secondary header that specifies which attempts are for shots taken and shots landed. The only important thing to note is that we have to leave space for all the columns we will be merging. For example in the customMergeHeaders variable below, the zero index is a placeholder to skip column 1, the first index is the name of the first merged header, and the second and third are placeholders so that the next header will be in the right spot. Make sure you add the headers to the worksheet first before the data.
const customMergeHeaders = [
  "",
  "# of Basketball Shots Taken",
  "",
  "",
  "# of Basketball Shots Landed",
  "",
  "",
  "",
];
const customHeader = [
  "Name",
  "Attempt 1",
  "Attempt 2",
  "Total",
  "Attempt 1",
  "Attempt 2",
  "Total",
  "Average",
];
XLSX.utils.sheet_add_aoa(worksheet, [customMergeHeaders, customHeader]);
XLSX.utils.sheet_add_json(worksheet, excelData, {
  skipHeader: true,
  origin: -1,
});
The skipHeader property is included in the XLSX.utils.sheet_add_json() method call so that a header row is not generated. The origin: -1 property is there to specify that we want to append the data at the end of the worksheet (otherwise it will just starting overwriting cells from A1). All the data and headers should be in the right place after this step is complete.
Formatting
This is where we start using the styling options provided by xlsx-js-style. Up until this point, we have been using functionality provided to us by the community version of SheetJs.
Once all the data is in place, we can modify the cell styles to make the worksheet presentable and user-friendly. The first style modification we are going to make is merging the header cells. This is done by providing an array of range objects to the worksheet. A range object consists of an s and e property which represents the group of cells to merge. Cells are described as a set of coordinates where c stands for the column and r stands for the row. For the example above, we will telling the worksheet to merge two groupings of cells.
worksheet["!merges"] = [
  { s: { c: 1, r: 0 }, e: { c: 3, r: 0 } },
  { s: { c: 4, r: 0 }, e: { c: 6, r: 0 } },
];
The merged headers we want should span over the three columns of data for the “shots taken” and “shots landed” categories which are cells B1 (c1,r0) to D1 (c3,r0) and E1 (c4,r0) to G1 (c6,r0).
Next, we can iterate through all the existing cells and update the styles we want for them. We can get the range of columns and rows from decoding the special worksheet property !ref. Like the coordinates above, range should have a s and e property. By getting the coordinates of the last cell in our worksheet, we can get the length of the columns and rows.
const range = XLSX.utils.decode_range(worksheet["!ref"] ?? "");
const rowCount = range.e.r;
const columnCount = range.e.c;
As we iterate through all the cells, we can check for specific columns or rows where we want to add different formatting. In the example code below, we target the first two rows and first column so that we can bold the names and headers. Each cell contains an object that holds information like the value and styling. In this case, we want to modify the s property to include styles for bolding the value and aligning it in the center. The rest of the cells are just assigned center alignment.
If there are certain values that you want to assign a special style, you can check the v property to check that cell’s value. As a side note, if a cell was never assigned a value, trying to access its style property may result in an undefined error.
for (let row = 0; row <= rowCount; row++) {
  for (let col = 0; col <= columnCount; col++) {
    const cellRef = XLSX.utils.encode_cell({ r: row, c: col });
    // Add center alignment to every cell
    worksheet[cellRef].s = {
      alignment: { horizontal: "center" },
    };
    if (row === 0 || row === 1 || col === 0) {
      // Format headers and names
      worksheet[cellRef].s = {
        ...worksheet[cellRef].s;
        font: { bold: true },
      };
    }
  }
}
Lastly, we have to add the appropriate formulas for the total and average columns. Formulas are applied in the same way as styles except in this case we modify the f property. We are targeting the third and sixth column for the totals and the seventh column for the average. The code below can be placed right before the else block from above.
else if (col === 3 || col === 6) {
  // Add formulas for totals
  const valueOneCellRef = XLSX.utils.encode_cell({r: row, c: col - 2});
  const valueTwoCellRef = XLSX.utils.encode_cell({r: row, c: col - 1});
  worksheet[cellRef].f = `${valueOneCellRef}+${valueTwoCellRef}`;
} else if (col === 7) {
  // Add formulas for average
  const totalShotsCellRef = XLSX.utils.encode_cell({r: row, c: 3});
  const totalLandedCellRef = XLSX.utils.encode_cell({r: row, c: 6});
  worksheet[cellRef] = {
    f: `${totalLandedCellRef}/${totalShotsCellRef}`,
    s: {
      ...worksheet[cellRef].s;
      numFmt: '0.00%',
    },
  };
}
Exporting
The very last step to the process is exporting the Excel file. This can be done using the XLSX.write() function to create a buffer and using the buffer to upload or write the file somewhere.
XLSX.utils.book_append_sheet(workbook, worksheet, "sheet_name_here");
const excelBuffer = XLSX.write(workbook, {
  type: "buffer",
  cellStyles: true,
});

fs.writeFileSync("fundraising_data.xlsx", excelBuffer);
Conclusion
SheetJs is a great tool for generating Excel sheets and, while daunting at first, a proper strategy can simplify the process. Breaking the process up into creating a template, ingesting the raw data, appending to an excel worksheet, and formatting the cells has helped me outline a clear plan of action for dealing with more complicated data structures. I hope that the simple strategies outlined in this blog post can help you get started or inspire you to create interesting solutions. Thanks for reading!