How I chose the #1 graph library for my React project
Tomas Piga10 min read
TL;DR
Reviewed the 6 most recommended React libraries and found the following answers among them:
- Strongest community support? Recharts
- Most liked libraries? Nivo and VX
- Most graphs and features? React-Vis
- Most maintained currently? Victory
- Starting a long-term project? React-Vis
- The least likely to have a bug? VX
- Quickest to load on mobile? VX
- For prototyping, the most preferred out-of-the-box design? Nivo
- The easiest documentation to build something specific quickly? Victory
Read on to find out why 🙀🚀📈👾
Context
I’ve witnessed projects lose time and trust because they picked a library that didn’t match their needs. Don’t make the same mistake and use this guide to make a better decision about both your graphing library, but also about other types of libraries in the future.
I curate a selection of the best React graph libraries, dig into what makes good measures, then critically and succinctly review their advantages. For the best JavaScript graphing library instead, see our neighbour article.
Overview
- The libraries
- The criteria
- Evaluation
- Popularity
- Reviews
- Functionality
- Maintainability
- Size
- Ease of development / prototyping
- Epilogue
The libraries
There’s several ways the top x libraries can be chosen: asking colleagues, reading online forums, or articles. For a strong consensus, I reviewed the first 6 articles [1, 2, 3, 4, 5, 6] I found after searching for top React libraries. By seeing which library was listed the most, I was able to reduce the list from over 100 to the following 6 most recommended libraries:
The criteria
To build a great product using many libraries, you need to turn your requirements into the correct technical decisions almost daily.
When working on new features, or even new products entirely, I’ve noticed 7 elements which can be important to saving time. I’ve turned these into criteria in order to easier guide you through these decisions.
Although not all may be relevant for every library, reading through these can at least help raise questions to clarify the intention and product characteristics. If you know the answers, then pick the ones that are relevant to your project.
Popularity
An easy instant indicator for the general appeal of a library and how well it has performed in the community over a long time
- ✅ A popular library will inevitably mean a lot of community support (eg: StackOverflow, GitHub issues)
- ⛔️ Popularity can be an unreliable indicator due to a knock-on effect which means it’s not always the best catch-all indicator
Reviews
A graphing library is a product at the end of the day which is why the ratio of good reviews to general use can help discriminate between good and bad implementations
- ✅ Good reviews generally indicate that a library covers a particular use case or community really well, or that’s in general high quality
Functionality
Not all graphing libraries offer every kind of chart and the features you need. The important thing here is to:
- ✅ Not lock yourself out of covering your requirements
- ✅ If you’re unsure of your requirements, picking the most general library may be the best option
- ✅ By using already bundled features, you may find yourself saving time
Maintenance
Sicara asked the CTO of a data visualisation company what was the first thing he checked to choose the right JS charting library. His answer was: the activity and popularity of the Github repository.
- ✅ Good maintainability means bugs are fixed on a regular basis and issues are debated on GitHub
- ✅ An updated codebase as code standards change over time
- ✅ Higher chance of new features in the future
Size and dependancies
- ✅ A lower size can mean higher performance on mobile. With packages depending on other packages it’s easy to bloat your download or load times
- ✅ Less dependancies mean less potential security vulnerabilities and other issues
Design
The presentation of graphs in a library is a very opinionated topic. A library coming with a great design out-of-the-box can:
- ✅ Save time in developing a ready-to-ship product for teams that don’t have a designer
- ⛔️ Can be less customisable and difficult to alter if you already have a specific design
Documentation
There are so many variables and use cases of libraries that the docs and examples are absolutely key to both saving time, and having a stress-free developer experience in general, more specifically:
- ✅ Useful for very specific requirements which require high customisation
Popularity
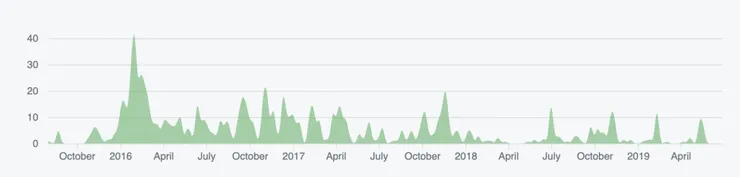
To gauge the popularity, I looked at the number of package downloads over the last 2 years.
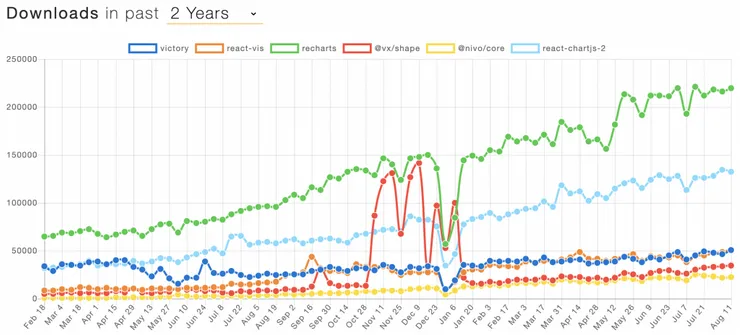
Number of downloads of the top 6 React graphing libraries. This chart won’t stay updated, but you can check out the comparison directly.
As you can see Recharts has double the number of downloads than the second-best. And even Chart.js for React (react-chartjs-2) has a few times more downloads than any of the others.
The chart allows us to see that downloads are not only currently high, but have been historically high and so a good indication for a lot of community experience and time with these libraries.
Reviews
To try to estimate the general quality of a library, I contrast the stars of their GitHub repository versus their downloads.
| Stars | Downloads | Rating (%) | |
|---|---|---|---|
| React-Vis | 5,963 | 51,290 | 12 |
| Victory | 3,263 | 50,841 | 6 |
| Recharts | 12,143 | 219,543 | 5 |
| VX | 6,266 | 34,433 | 26 |
| Nivo | 5,604 | 22,842 | 24 |
| Chart.js (React) | 2,104 | 132,681 | 2 |
Legend: Where rating is the stars over the number of downloads.
Nivo and VX are really well received with about 1 in every 4 people starring the library. Meanwhile, only about 1 in every 50 people star the Chart.js (React) library. This really shows popularity is not necessarily correlational with quality.
Instead, one reason they could be so popular is through SEO optimisation. Recharts and Chart.js (React) are both ranked #1 for googling terms “charts react” and “charts javascript” respectively. Chart,js is also very popular because of its strong and historic JavaScript version (see this).
Functionality
General use
There are 4 main functions for graphs and so first I define what types of graph could be expected for each. Then, I look through the libraries and see how well they cover these to give
- Basic: line, bar, column, scatter plot, bubble, donut / pie, and area charts
- Scientific: contour plot, heat map, ternary plot, polar graph, carpet plot, and parallel coordinates plot
- Financial: crucial are time series and candlesticks, though zoom, brush, and others are useful too
- Statistical: error bars, box plots, 2D density plots, tree map
| Basic | Scientific | Financial | Statistical | |
|---|---|---|---|---|
| React-Vis | Line Series, Bar Series, Label Series, Arc Series, Area Series | Contour Series, Heatmap Series, Radar Chart, Parallel Coordinates | Time Chart, Candlestick, Whisker Series, Zoom, Tooltips | Whisker Series, Sunburst, Treemap, Polygon Series |
| Victory | VictoryLine, VictoryBar, VictoryScatter, VictoryPie, VictoryArea | VictoryLine (polar property), VictoryPolarAxis, VictoryVoronoi | Time Scale, VictoryCandleStick, VictoryCursorContainer, VictoryZoomContainer, VictoryBrushContainer | VictoryErrorBar, VictoryBoxPlot |
| Recharts | LineChart, BarChart, ScatterChart, PieChart, AreaChart | RadarChart, | PolarGrid | Time Ticks, |
| VX | Shape.Line, Shape.Bar, Shape.Circle, Shape.Pie, Shape.AreaClosed | Heatmap.Heatmap, Shape.LineRadial, Voronoi.VoronoiPolygon, RadarChart | Areas demo (time), Stats plots demo, Threshold demo | BoxPlot + ViolinPlot, TreeMap |
| Nivo | Line, Bar, ScatterPlot, Pie, Stream | Heatmap, Bump (parallel), ParallelCoordinates, Voronoi, RadarChart | Bullet | Sunburst, TreeMap, Waffle |
| Chart.js (React) | Line, Bar, HorizontalBar, Scatter, Bubble, Doughnut, Pie | Polar, Radar | Time x-axis |
Legend: Green means good support, yellow means partial support, and blank means either no support, or very limited support.
Features
| Animations | Interactive | Responsive | TypeScript | |
|---|---|---|---|---|
| React-Vis | No brush | DefinitelyTyped | ||
| Victory Charts | Customisable | |||
| Recharts | ||||
| VX | Specialised zoom | vx-typescript-kitchensink | ||
| NIVO | Best | No, PRs exist but outdated | vx-typescript-kitchensink | |
| Chart.js (React version) | Not easily | Partial |
Legend: Green means good support, yellow means partial support, and red means either no support, or very limited support.
Unique Features
- Victory also has a Victory Native (for React Native)
- Nivo offers server-side rendering (SSR)
- React-Vis and Nivo offer graphs in both canvas or SVG form
TypeScript
It’s unusual to find libraries natively typed in TypeScript, in which case you can search for the separate NPM definition here. If there’s no official definition, Definitely Typed contains high quality definitions. Alternatively, you may find some that people have submitted through various issues or open pull requests.
Licensing
All of these libraries currently have an MIT license. This means they are free-to-use for both personal projects and commercially. In general, you can find licensing in the top-right of a library’s GitHub page.
Maintainability
Current support
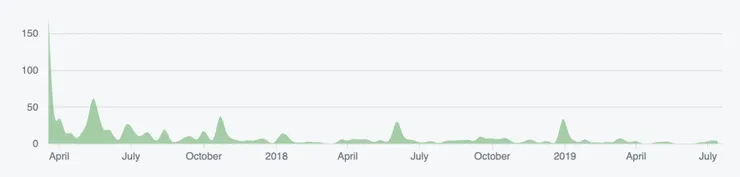
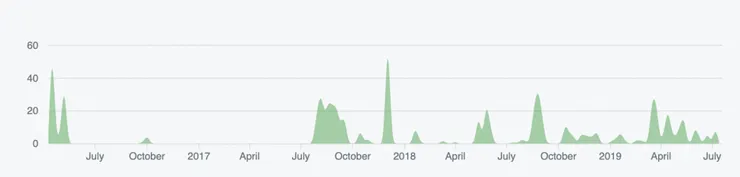
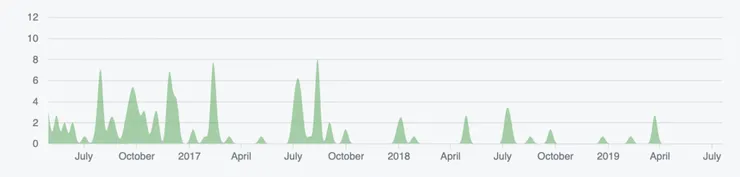
The pulse of a library is GitHub’s way of showing you the contribution to a library in terms of commits over time. You can find it in the insights tab of each repository.
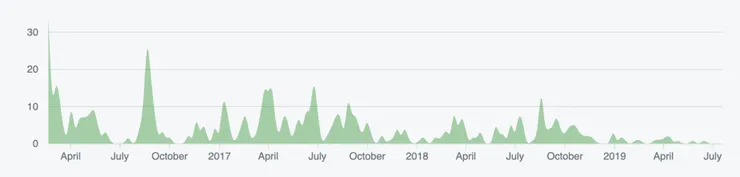
React-Vis (Feb 21, 2016 – Jul 20, 2019)
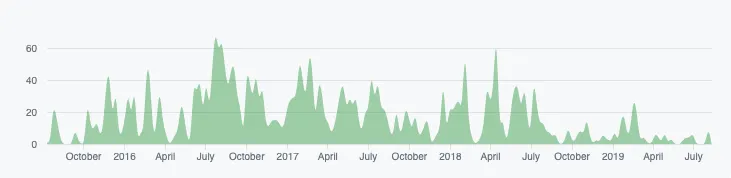
Victory (Jul 26, 2015 – Jul 20, 2019)
Recharts (Aug 2, 2015 – Jun 29, 2019)
VX (Mar 19, 2017 – Jul 20, 2019)
Nivo (Apr 10, 2016 – Jul 20, 2019)
Charts.js, React (May 1, 2016 – Jul 20, 2019)
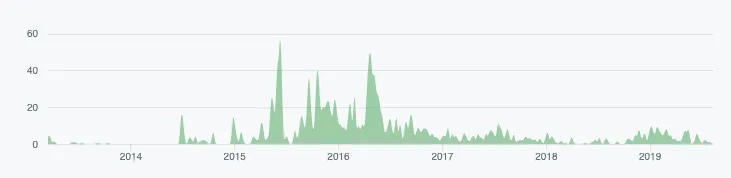
Chart.js (Mar 17, 2013 – Aug 12, 2019)
Victory looks to have the best pulse, with React-Vis and Recharts also having fairly regular contributions.
Continued support and bugs
The distribution of commits across the top contributors can show its support structure and the likelihood of continued support. Under the issues tab, you can see both bugs and features that have been previously reported (open issues), and solved (closed issues) - a great indicator of the library healthiness.
| Creation | Contributors | SPOF (%) | Chance of bug | |
|---|---|---|---|---|
| React-Vis | Feb, 2016 | 40 | 39 | 1 in 255 |
| Victory | Jul, 2015 | 31 | 71 | 1 in 333 |
| Recharts | Aug, 2015 | 51 | 79 | 1 in 376 |
| VX | Mar, 2017 | 28 | 90 | 1 in 889 |
| Nivo | Apr, 2016 | 11 | 96 | 1 in 300 |
| Chart.js (React) | May, 2016 | 13 | 50 | 1 in 687 |
| Chart.js | Mar, 2017 | 97 | 57 | 1 in 1,257 |
Legend: contributors are the number of users who made at least 2 commits, SPOF is the Single Point of Failure chance calculated by taking the highest contributors commits over the top 5 contributors’ commits, and the change of bug is the number of open issues over the number of downloads (essentially the likelihood that you’ll encounter an existing issue).
The most distributed support is in React-Vis and Chart.js. React-Vis is backed by Uber, so there is probably a dedicated team or rota around maintaining the library. Even though Chart.js doesn’t belong to a company, its JavaScript contribution profile is very diverse.
The libraries which look to have the least bugs are VX and Chart.js. Bear in mind that this is only an estimate as some may be more common than others. Regardless of this, most libraries reach a common number, with an exception of VX which is exceptional in keeping open issues low; only 33 open.
Size
To find out the size of a library, you need to both look at its own size and also the size of its dependencies. Bundlephobia gives you an instant computed response, and allows you to see the library size growth over time.
| Compressed size (KB) | Dependencies | Modularised | Notes | |
|---|---|---|---|---|
| React-Vis | 79.1 | 18 | No | |
| Victory | 116.7 | 25 | No | |
| Recharts | 119.2 | 11 | No | |
| VX | 52.4 | - | Yes | @vx/grid, @vx/group, @vx/shape, @vx/axis, @vx/scale |
| Nivo | 82.5 | 11 | Yes | @nivo/line |
| Chart.js (React) | 120.4 | 5 | No | Also requires charts.js |
Legend: Size is the min-zipped size of the library including all of its dependancies, modularised means whether the library is split into components so you can import only the parts
For a simple graph, in a standard 3G network at 50KB/s:
- The smallest modules (VX) take 1.0 seconds to download
- The largest libraries (Victory, Recharts, and Chart.js) take about 2.4 seconds.
Though the former will tend towards the latter as you start to add more complex charts.
Ease of development / prototyping
Design
This is a subjective topic, so this section is for determining the generally preferred design and UX philosophy. To confirm this, I asked colleagues and contacts throughout London to rank these 6 libraries in order of best to worst. The final statistic is their average rank (from 1 being the best to 6 being the worst).
- React-Vis - 4.3
- Victory - 4.7
- Recharts - 2.4
- VX - 4.4
- Nivo - 2.1
- Chart.js (React) - 3.0
The results showed that Nivo and Recharts were much preferred over the React-Vis, VX, and Victory, with Chart.js sitting somewhere between.
The Nivo design was said to be accessible. Although VX appeared stylish, the impression was that it was trying too hard to have an opinionated great look, whilst disregarding some standard UX.
Documentation
| Search | Resources | Examples | CodePen / JSFiddle | |
|---|---|---|---|---|
| React-Vis | Docs | Showcase Storybook | Line | |
| Victory | Docs | In docs | Responsive docs | |
| Recharts | Docs | In docs Showcase | Line Bar Pie | |
| VX | Docs | Showcase | ||
| Nivo | Docs | In docs Storybook | ||
| Chart.js (React) | JavaScript Docs | In docs React showcase | JavaScript Line JavaScript Bar JavaScript Pie |
Victory leads in this area with each of its examples being responsive - allowing you to easily add and quickly test parameters. The search worked for both graphs and props to the graph which made it very easy to find whether certain features existed.
Nivo is the follow-up as the interactive demos allow a very clean way for even a UX/designer/product manager to find the right combination. However it lacked a thorough search throughout the library and the demo code itself wasn’t directly editable.
Epilogue
The most important part of all of this is to find out what your requirements are. What are you building?
Once you know that, then you can pick the library that suits exactly your need and enjoy the benefit that comes from that. Whether this is an improved user experience on mobile, or an excellent prototype to show to your stakeholders. Unsure about your requirements? Go with the catch-all React-Vis.
If you’ve found this useful, you’ll probably like some of the other articles we’ve posted on our Theodo blog, so check them out! If you’d like to join us, or start a project with us, visit our website for more info!