Deep-dive into an Ajax request with Wireshark
Romain Marquant11 min read

As Web developers, Ajax requests have become a routine. We use them every day to retrieve and send data from/to a server. But do you really know what is happening when the request leaves your browser?
I will not go too much into detail as to what is happening on the client before sending the request. What I would like to show you is what happens when the HTTP request is sent out to the network.
Let’s take a simple use case. A simple VueJS To-do app, that fetches To-dos from JSONPlaceHolder an open fake REST API. In your code, somewhere we need to call the server (with the help of Axios):
const url = 'http://jsonplaceholder.typicode.com/todos'
axios.get(url)
  .then(function (response) {
    this.todos = response
  })
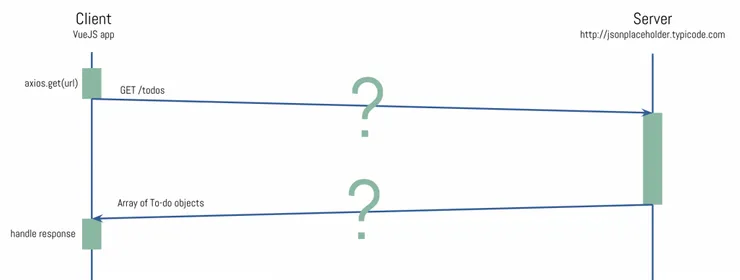
To understand what is going on inside those 2 blue arrows, I will use a simple tool called Wireshark.
What is Wireshark?
Wireshark is an open-source network packet analyzer. It is commonly used in network troubleshooting, and several areas of cyber security like pentesting or retro-engineering. In our case it will help capture everything that is going on behind the scene when making an HTTP call.
It works as a probe, comparable to tcpdump, with little to no impact on performance and it requires a very little change on your machine to make it work. One little package to install.
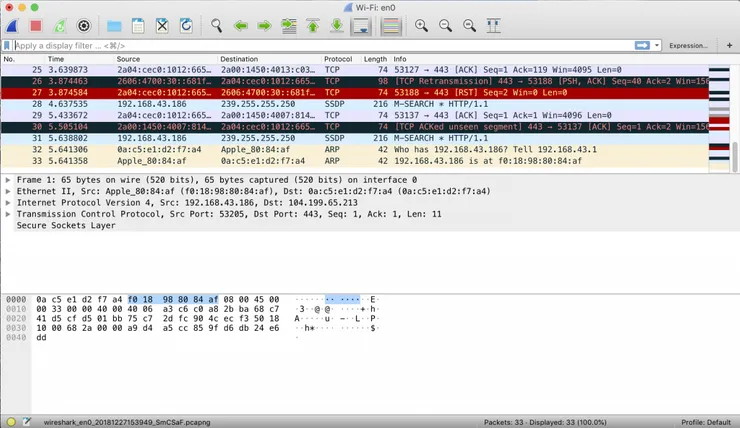
What makes its popularity, compared to his friend tcpdump is its increased number of command line options & filters, its easier-to-read output, and last but not least, Wireshark also comes with a nice GUI:
How to install Wireshark
If you wish to install it on your local computer, you can refer to the Official Wireshark download page.
Otherwise, if you do not have access to any graphical UI, which was my case, you can install it with apt:
sudo add-apt-repository ppa:wireshark-dev/stable
sudo apt-get update
sudo apt-get install tshark #Commandline version of Wireshark
During the installation, you will be asked if you wish to allow other users to run Wireshark, answer ‘NO’.
Here, having to run tshark as root is fine. But once you start doing more complex things (like scripting) you should really consider using a normal user to prevent your script from having root access.
Now, to test that everything worked, launch the tshark tool by running:
sudo tshark
It will tell you that it started capturing, and you should start seeing some packets coming in. At this point, what you see may be complete nonsense, don’t worry, I’ll explain.
However, if you get an error like couldn’t run /usr/bin/dumpcap in child process: Permission Denied, you can run:
sudo chmod +x /usr/bin/dumpcap
Configuration
The good, and the bad thing with Wireshark, is that it will capture everything that is going in or out of your machine. You can try from your personal laptop, if like me you have 10 chrome tabs open plus some music, you will see that there is a lot going on!
About filters
If you are using tshark on a remote machine you are connected to with SSH, you will see a lot of noise due to SSH packets going in and out between the machine and your computer. To get rid of them, let’s use some filters:
tshark -f 'not port 22'
This will hide everything that is going through port 22 (SSH).
You can also filter by host: host XXX.XXX.XXX.XXX or indicate a portrange 1501-1549. For a more complete list of filters, you can go to the official documentation.
Another useful one is the ip filter. Setting it will hide all lower level packets like ARP. Let’s use it:
tshark -f 'ip and not port 22'
Network interfaces
By default, Tshark will listen on your default network interface. For some reason, you might want to listen to a different interface, for example, a Docker network, or localhost. You can specify the one you want with the -i option followed by the name of the interface. Here’s what my command looks like now:
tshark -f 'ip and not port 22' -i eth0
You can get the list of network interfaces with ifconfig or route.
With this command, I will capture all packets going through the eth0 interface that is using the IP protocol and is not SSH. Great!
What the **** is this?
Let’s dig into the logs. Here’s what I captured:
Capturing on 'eth0'
     1 0.000000000 172.31.14.179 → 172.31.0.2   DNS 99 Standard query 0xea8d A jsonplaceholder.typicode.com OPT
     2 0.000108469 172.31.14.179 → 172.31.0.2   DNS 99 Standard query 0x5ed5 AAAA jsonplaceholder.typicode.com OPT
     3 0.003702106   172.31.0.2 → 172.31.14.179 DNS 131 Standard query response 0xea8d A jsonplaceholder.typicode.com A 104.18.49.3 OPT
     4 0.004056574   172.31.0.2 → 172.31.14.179 DNS 155 Standard query response 0x5ed5 AAAA jsonplaceholder.typicode.com AAAA 2606:4700:30::6812:3003 OPT
     5 0.011988153 172.31.14.179 → 104.18.49.3  TCP 74 39008 → 80 [SYN] Seq=0 Win=26883 Len=0 MSS=8961 SACK_PERM=1 TSval=1897041053 TSecr=0 WS=128
     6 0.018559911  104.18.49.3 → 172.31.14.179 TCP 66 80 → 39008 [SYN, ACK] Seq=0 Ack=1 Win=29200 Len=0 MSS=1460 SACK_PERM=1 WS=1024
     7 0.018573608 172.31.14.179 → 104.18.49.3  TCP 54 39008 → 80 [ACK] Seq=1 Ack=1 Win=27008 Len=0
     8 0.018621187 172.31.14.179 → 104.18.49.3  HTTP 151 GET /todos HTTP/1.1
     9 0.025138648  104.18.49.3 → 172.31.14.179 TCP 54 80 → 39008 [ACK] Seq=1 Ack=98 Win=29696 Len=0
     10 0.030261762  104.18.49.3 → 172.31.14.179 TCP 1514 HTTP/1.1 200 OK  [TCP segment of a reassembled PDU]
     11 0.030281381 172.31.14.179 → 104.18.49.3  TCP 54 39008 → 80 [ACK] Seq=98 Ack=1461 Win=29824 Len=0
     12 0.030287980  104.18.49.3 → 172.31.14.179 TCP 4434 HTTP/1.1 200 OK  [TCP segment of a reassembled PDU]
     13 0.030292964 172.31.14.179 → 104.18.49.3  TCP 54 39008 → 80 [ACK] Seq=98 Ack=5841 Win=38656 Len=0
     14 0.030294315  104.18.49.3 → 172.31.14.179 TCP 1514 HTTP/1.1 200 OK  [TCP segment of a reassembled PDU]
       [...]
     26 0.031787572  104.18.49.3 → 172.31.14.179 TCP 1514 HTTP/1.1 200 OK  [TCP segment of a reassembled PDU]
     27 0.031791396 172.31.14.179 → 104.18.49.3  TCP 54 39008 → 80 [ACK] Seq=98 Ack=24821 Win=76544 Len=0
     28 0.031795896  104.18.49.3 → 172.31.14.179 HTTP 211 HTTP/1.1 200 OK  (application/json)
     29 0.031797814 172.31.14.179 → 104.18.49.3  TCP 54 39008 → 80 [ACK] Seq=98 Ack=24978 Win=79488 Len=0
     30 0.036960827 172.31.14.179 → 104.18.49.3  TCP 54 39008 → 80 [FIN, ACK] Seq=98 Ack=24978 Win=79488 Len=0
     31 0.056164064  104.18.49.3 → 172.31.14.179 TCP 54 80 → 39008 [FIN, ACK] Seq=24978 Ack=99 Win=29696 Len=0
     32 0.056168784 172.31.14.179 → 104.18.49.3  TCP 54 39008 → 80 [ACK] Seq=99 Ack=24979 Win=79488 Len=0
Let’s take the first line:
1 0.000000000 172.31.14.179 → 172.31.0.2 DNS 99 Standard query 0xea8d A jsonplaceholder.typicode.com OPT
- 1: The packet number. It will start at 1 on the first recorded (and displayed) packet.
- 0.000000000: The time in seconds since the first packet.
- 172.31.14.179: The source IP address (here the client machine)
- 172.31.0.2: The destination IP address (the DNS server)
- DNS: The packet protocol
- 99: The packet payload size in bytes
- Standard query 0xea8d A jsonplaceholder.typicode.com OPT: A recap of the payload. It is computed by Wireshark and changes from one protocol to another.
Is it clearer? Not completely? Let’s take the trace chunk by chunk to better understand
DNS
     1 0.000000000 172.31.14.179 → 172.31.0.2   DNS 99 Standard query 0xea8d A jsonplaceholder.typicode.com OPT
     2 0.000108469 172.31.14.179 → 172.31.0.2   DNS 99 Standard query 0x5ed5 AAAA jsonplaceholder.typicode.com OPT
     3 0.003702106   172.31.0.2 → 172.31.14.179 DNS 131 Standard query response 0xea8d A jsonplaceholder.typicode.com A 104.18.49.3 OPT
     4 0.004056574   172.31.0.2 → 172.31.14.179 DNS 155 Standard query response 0x5ed5 AAAA jsonplaceholder.typicode.com AAAA 2606:4700:30::6812:3003 OPT
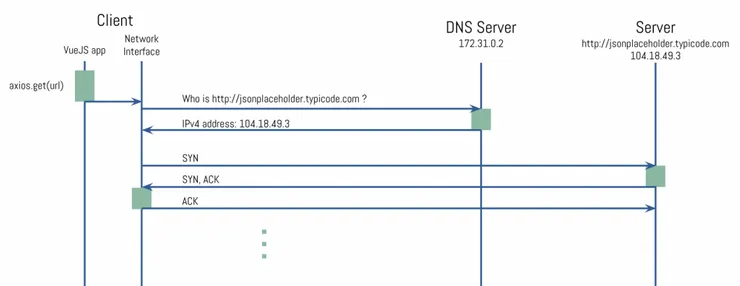
These first 4 packets indicate they are using the DNS protocol. It is coming from our machine, and going to 172.31.0.2.
This is the trace of the client’s DNS lookup to get JSONPlaceHolder’s server IP address from its domain name. From this point, this is a simple Query -> Response exchange. The server’s response being: “The address for www.google.fr is 104.18.49.3”
There are actually 2 queries launched at once: one A is asking for the IPv4 address, and the other AAAA for the IPv6 one.
From the timings, we can see that the complete DNS resolution took 4.05 ms.
Here’s what it looks like on our diagram:
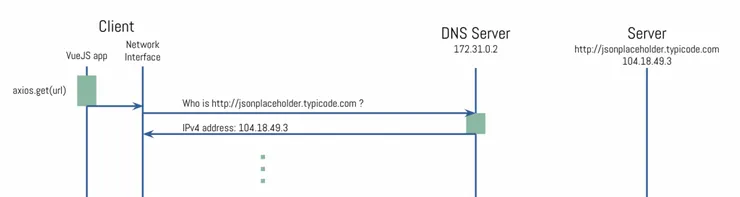
Of course, it is not the JS application who will do the job, It will only forward the HTTP Request to the Network Interface, who will be handling it.
TCP Handshake
Now that we know the server’s address, we imagine to see the HTTP request going to the server. Here it is a little lower:
8 0.018621187 172.31.14.179 → 104.18.49.3 HTTP 151 GET /todos HTTP/1.1
But as you noticed, it does not start directly after the DNS resolution, first you see those:
     5 0.011988153 172.31.14.179 → 104.18.49.3  TCP 74 39008 → 80 [SYN] Seq=0 Win=26883 Len=0 MSS=8961 SACK_PERM=1 TSval=1897041053 TSecr=0 WS=128
     6 0.018559911  104.18.49.3 → 172.31.14.179 TCP 66 80 → 39008 [SYN, ACK] Seq=0 Ack=1 Win=29200 Len=0 MSS=1460 SACK_PERM=1 WS=1024
     7 0.018573608 172.31.14.179 → 104.18.49.3  TCP 54 39008 → 80 [ACK] Seq=1 Ack=1 Win=27008 Len=0
This sequence of packets is called the TCP 3-way handshake. It is what the TCP protocol requires to setup a new connection between 2 machines.
In the payload recap, you can see the source port 39008 and the destination port 80. The source port (on your machine) is picked randomly, but the destination port does indicate that you are looking to use HTTP afterwards. Good, it means it’s what we’re looking for!
The Handshake here is quite fast (6.5 ms) which might not be the case all the time depending on the geographical proximity of the machines and the network’s health.
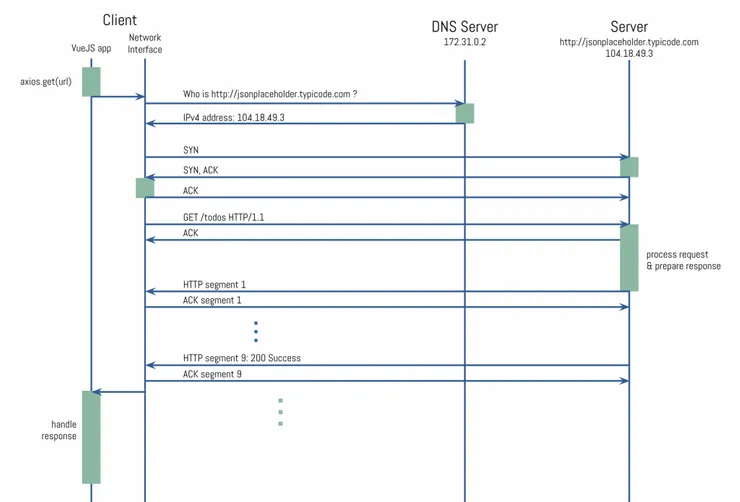
The HTTP Request
Everything went as planned, the client and the server got to know each other. We can finally make the GET request to our server.
     8 0.018621187 172.31.14.179 → 104.18.49.3  HTTP 151 GET /todos HTTP/1.1
     9 0.025138648  104.18.49.3 → 172.31.14.179 TCP 54 80 → 39008 [ACK] Seq=1 Ack=98 Win=29696 Len=0
     10 0.030261762  104.18.49.3 → 172.31.14.179 TCP 1514 HTTP/1.1 200 OK  [TCP segment of a reassembled PDU]
     11 0.030281381 172.31.14.179 → 104.18.49.3  TCP 54 39008 → 80 [ACK] Seq=98 Ack=1461 Win=29824 Len=0
     12 0.030287980  104.18.49.3 → 172.31.14.179 TCP 4434 HTTP/1.1 200 OK  [TCP segment of a reassembled PDU]
     13 0.030292964 172.31.14.179 → 104.18.49.3  TCP 54 39008 → 80 [ACK] Seq=98 Ack=5841 Win=38656 Len=0
     14 0.030294315  104.18.49.3 → 172.31.14.179 TCP 1514 HTTP/1.1 200 OK  [TCP segment of a reassembled PDU]
     15 0.030296742 172.31.14.179 → 104.18.49.3  TCP 54 39008 → 80 [ACK] Seq=98 Ack=7301 Win=4160 Len=0
       [...]
     26 0.031787572  104.18.49.3 → 172.31.14.179 TCP 1514 HTTP/1.1 200 OK  [TCP segment of a reassembled PDU]
     27 0.031791396 172.31.14.179 → 104.18.49.3  TCP 54 39008 → 80 [ACK] Seq=98 Ack=24821 Win=76544 Len=0
     28 0.031795896  104.18.49.3 → 172.31.14.179 HTTP 211 HTTP/1.1 200 OK  (application/json)
     29 0.031797814 172.31.14.179 → 104.18.49.3  TCP 54 39008 → 80 [ACK] Seq=98 Ack=24978 Win=79488 Len=0
From packet 14 to 26, I hid the packets to help the readability, but they are all equivalent to 14 and 15
Here, the first thing that should strike you is that for each HTTP packet, a TCP one is sent back:
     8 0.018621187 172.31.14.179 → 104.18.49.3  HTTP 151 GET /todos HTTP/1.1
     9 0.025138648  104.18.49.3 → 172.31.14.179 TCP 54 80 → 39008 [ACK] Seq=1 Ack=98 Win=29696 Len=0
Everything encapsulated to TCP has to be sent through. This means every time one of the 2 machines receives a packet, it will send another one back to inform the sender that it has received it: ACK is short for acknowledgement.
This also means that if for some reason the packet 8 gets lost and the client never receives an ACK for it, it will send it again until it receives the ACK.
Now, as you can see, the HTTP Request is sent on packet 8 and acknowledged on packet 9. Then, from packet 10 to 27, the HTTP Response is being received from the server. There are 9 packets sent to retrieve the full response, because TCP splits the response into chunks. What it means to us is we have to wait for all chunks to have been downloaded to see the complete response.
It’s important to note that if the Round Trip Time (RTT) between your 2 machines is important, the bigger the size of the response the more chunks will be sent, which means you will have to wait more RTTs to receive it entirely.
At packet 14 the full HTTP response is received from the server. Performance-wise:
- The TTFB (Time To First Byte) is the time from packet 8 to packet 10: 11.6ms
- The Download time from packet 10 to 28: 1.5ms
At packet 28, your JS app has received the HTTP response, and can start handling the response:
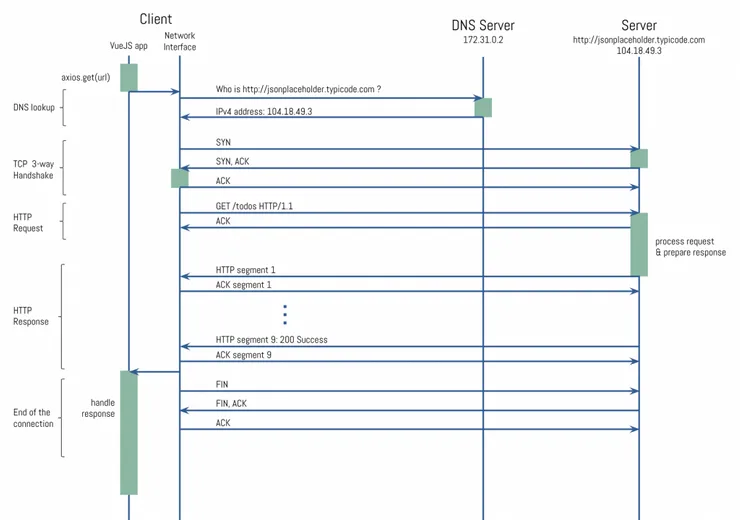
Finalization of the connection
Now that the client got what he wanted, it is time to close the TCP connection:
     30 0.036960827 172.31.14.179 → 104.18.49.3  TCP 54 39008 → 80 [FIN, ACK] Seq=98 Ack=24978 Win=79488 Len=0
     31 0.056164064  104.18.49.3 → 172.31.14.179 TCP 54 80 → 39008 [FIN, ACK] Seq=24978 Ack=99 Win=29696 Len=0
     32 0.056168784 172.31.14.179 → 104.18.49.3  TCP 54 39008 → 80 [ACK] Seq=99 Ack=24979 Win=79488 Len=0
I won’t go too much into detail here, as the sequence is quite similar to the Handshake. Only here, it’s time for the Client to say “Goodbye” to the Server, hence the FIN keyword. If you want to know more, I strongly recommend you to dig into the TCP protocol, and all it’s specifications.
Conclusion
Now a HTTP request has no more secrets for you, If you want to keep learning about Web protocols (and not only), you can start by recording an HTTPS request to see the differences.
You can also use Wireshark to record all kinds of protocols: such as MySQL, DNS, LDAP, … and discover the wonderful world of Networking!
I hope you enjoyed reading this article. Next time, I will show you how to detect network latencies with Wireshark and how to improve your requests performance!