How to debug your front-end/back-end interface with the Developer Tools network tab
Jordan Lao3 min read

When I started web development, the developer tools were so new to me I thought I would save time not using them in the first place. I quickly realized how wrong I was as I started using them. No more console.log required, debugging became a piece of cake in a lot of cases!
The Network tab is used to track all the interactions between your front end and your back end, thus the network.
In this article, I will show usages of the developer tools Network tab on Google Chrome web browser.
Let’s start exploring the network tab!
Record the network logs
The first thing to do is to record the network logs by making sure the record button is activated before going on the page you want to record:
![]()
Check the response of a request sent to your server
You can keep only the requests sent to your server by clicking on the filter icon and then selecting “XHR”:
![[Dev Tools] XHR Filter](/_astro/capture-d_eecran-2018-10-14-aa-10.31.52.CqTNbC23_Z1eBIso.webp)
In that section, you can see some information about your requests:
- HTTP status code
- Type of request
- Size of the request
- Etc.
To get more details about a request, you can simply click on it.
Let’s look at the my-shortcuts endpoint that retrieves the shortcuts of an user connected on the application I am using. You can look at the formatted response by clicking on the “Preview” tab:
![[Dev Tools] Preview tab](/_astro/capture-d_eecran-2018-10-14-aa-11.01.34.CpwmGtro_2ptH0E.webp)
If the response of an XHR is an image, you will be able to preview the image instead.
On this tab, it becomes easy to determine if the format of the response corresponds to what your front end expected.
Great! Now you know how to check the response of a request sent to your server without writing any console.log in your code!
Test your requests with various Internet connection speeds
If the users of the application you are developing have a lower Internet speed than yours, it can be interesting to test your application with custom Internet speed.
It is possible to do so by using bandwidth throttling by clicking on the following dropdown menu:
![]()
![[Dev Tools] Throttling 2](/_astro/capture-d_eecran-2018-10-14-aa-11.20.49-300x260.2cxlPKYa_Z1YN2hX.webp)
Replay a request
Replaying a request can be useful if you want to see how the front end interacts with the response of a request again or if you need to test your request with different parameters. It can be long and painful to reload the page and reproduce exactly the same actions over and over again. Here are some better ways to replay a request:
- When right-clicking on a request, you can copy the cURL format of your request and paste it in the terminal of your computer to send the request to your back end:
![[Dev Tools] Curl copy](/_astro/capture-d_eecran-2018-10-14-aa-11.55.54-2-1024x634.5UCNra8u_UXz0A.webp)
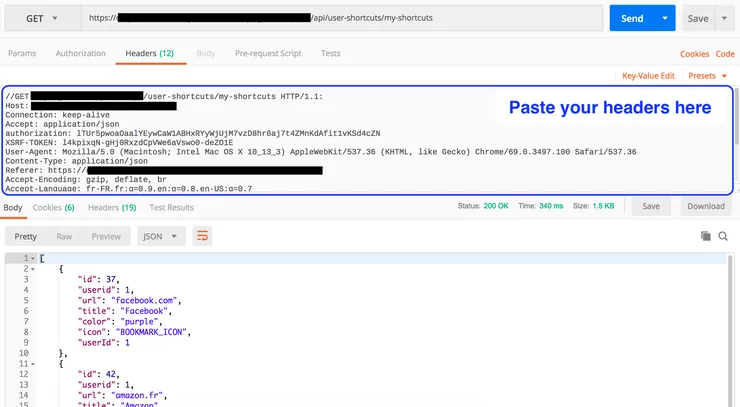
- When right-clicking on a request, you can copy the request headers and paste them in your favorite API development environment (e.g. Postman):
![[Dev Tools] Headers copy](/_astro/capture-d_eecran-2018-10-14-aa-11.55.54-1024x634.Co9seZul_1Nr27m.webp)
In Postman, click on “Headers tab” > “Bulk Edit” to edit the headers:
![]()
Now all you need to do is paste your headers. Don’t forget to comment the path of the request which is not a header:
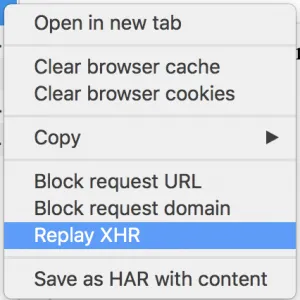
- If you are using “XHR” requests, you can simply right-click on the request you want to replay and click on “Replay XHR:
I hope that I could help you debug your network interactions with this article!


