Setting up Debugger for Node.js in Docker with VS code
Ho-Wan To3 min read
This is a quick guide on how to set up the debugger in VS code server-side for use with Node.js in a Docker container. I recently worked on a project which uses the Koa.js framework as the API. Whilst trying to set up the debugger with VS code, a google search led to several articles that had conflicting information about how to set it up and the port number to expose, or was overly verbose and complicated.
To keep things simple, I have split this into 3 steps.
1) Check version of Node.js on server
To do this with docker-compose set up, use the following, replace [api] with the name of your docker container.
docker-compose exec <span style="color: #ff0000;">api</span> node --version
Inspector Protocol (Node V7+, since Oct 2016)
Recent versions of Node.js now uses the inspector protocol. This is easier to set up and is the default setting for new Node.js applications, as most documentation will refer to this protocol. This means that:
- The
--inspectflag is required when starting the node process. - By default, the port 9229 is exposed, and is equivalent to
--inspect:9229 - The port can be changed, eg.
--inspect-brk:1234. Here, the ‘-brk’ flag adds a breakpoint on start.
Legacy Protocol (Node V6 and earlier)
Older versions of Node.js (prior to V7) uses the ‘Legacy Debugger’. The version of Node.js used on my project was 6.14. This means that:
- The
--debugflag is required when starting the node process. - By default, the port 5858 is exposed, and is equivalent to
--debug:5858 - This port cannot be changed.
For more information goto:
https://code.visualstudio.com/docs/nodejs/nodejs-debugging
https://nodejs.org/en/docs/guides/debugging-getting-started/
2) Expose port in Node and Docker
In ‘package.json’, add --debug:5858 (or --inspect:9229 depending on Node version) when starting Node, so:
"dev": "nodemon index.js", becomes
"debug": "nodemon --debug:5858 index.js",
In ‘docker-compose.yml’, run the debug node command and expose the port. In my case:
api:
  build: ./api
  command: yarn dev
  volumes:
    – ./api:/code
  ports:
    – "4000:4000"
becomes:
api:
  build: ./api
  command: yarn debug
  volumes:
    - ./api:/code
  ports:
    - "4000:4000"
    - "5858:5858"
3) Set launch configuration of Debugger
In ‘/.vscode/launch.json’, my launch configuration is:
{
  "type": "node",
  "request": "attach",
  "name": "Docker: Attach to Node",
  "port": 5858,
  "address": "localhost",
  "localRoot": "${workspaceFolder}/api/",
  "remoteRoot": "/code/",
  "protocol": "legacy"
}
The port and protocol needs to correspond to the version of Node used as determine above. For newer versions of Node: <span style="color: #0000ff;">"port": "9229"</span> and <span style="color: #0000ff;">"protocol": "inspector"</span> should be used.
”localRoot” and “remoteRoot” should be set to the folder corresponding to the entry point (eg. index.js) of your Node application in the local repository and the docker folder respectively.
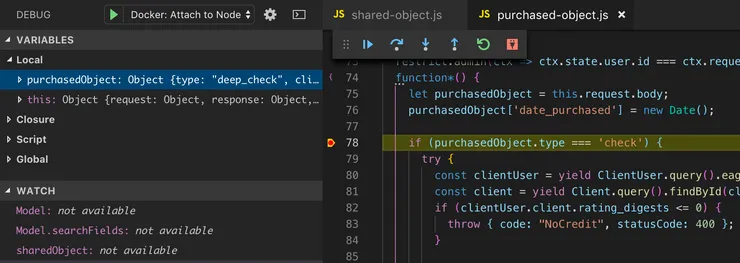
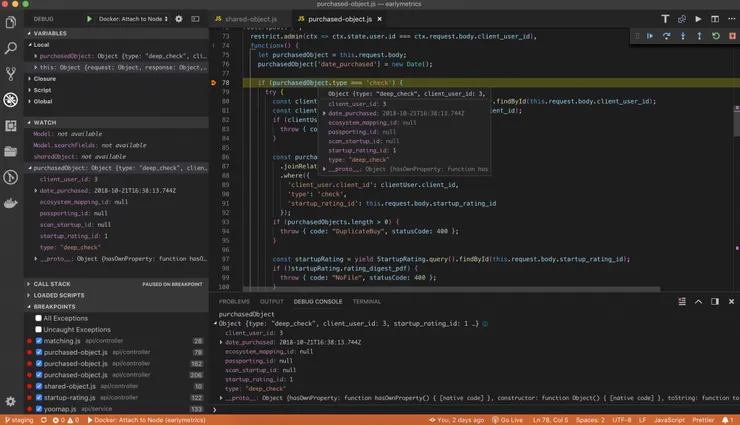
Attach debugger and go!
In VS code, set your breakpoints and press F5 or click the green triangle button to start debugging! By default VS code comes with a debug panel to the left and debug console to the bottom, and a moveable debug toolbar. Mousing over a variable shows its values if it has any.
Thanks for reading, I hope this article has been useful!