Debugging your Node.js server code in the browser
Eduardo San Martin Morote5 min read

As a developer, you get to debug your code very often. In JavaScript this is done
in the browser. Each browser having a different debugger, you may find out some
better than others but the truth is they are all very handy. However, this is for
in-browser JavaScript. What about server side JavaScript, the one you run
with node, iojs or some sexy compiler like coffee?
Usual front-end debugging
A lot of developers still use those ugly, yet handy console.log all around
the code to test the content of variables. This is usually a poor practice.
Placing a debugger instruction or, even better, using breakpoints, pauses the
execution workflow and lets you use watchers and the console to see the content
of the variables and to play around with them.
But this is only for front-end code, isn’t it?
Nope.
You can actually use the same debugger interface for your Node.js app and
forget about the console debugger, which is fully functional but feels slower
to use because you need to use lines number to place breakpoints.
Better back-end debugging
In order to get that nice debugging interface we need to use either Chrome or
Opera, and to use the node-inspector node package. Install it globally:
npm install -g node-inspector
If your application is written in JavaScript or if you have a js version of it
you can directly run your server and debugger with:
node-debug --no-preload server.js
I recommend using the --no-preload option since I have had big delays when not using it. It’s up to you to play around with it!
This will run your server and also serve a webpage containing the debugger. By
default this is run on port 8080, so you may need to change it using the -p
option. If your default browser is Chrome or Opera, this will also open it on a
new tab. Otherwise you will have to open it by yourself.
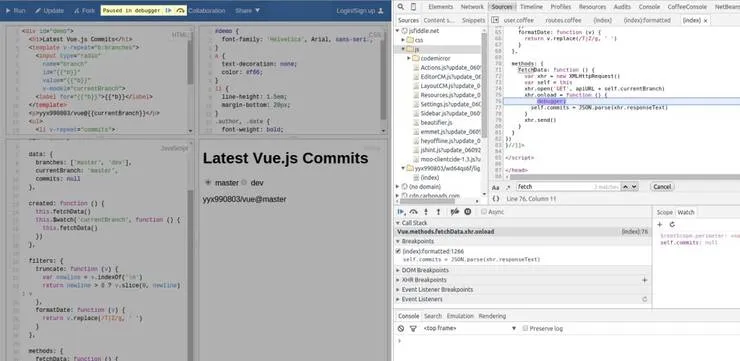
You will have access to a nifty interface. It’s basically the browser’s debugger
in fullscreen.
Using it with CoffeeScript (or any other compiler/transpiler)
In order to launch the debugger with compilers like CoffeeScript, you’ll have to
launch two different processes. One for your server and another for the debugger
interface.
When starting the server you must make it listen for debugger instructions. This
may vary depending on the compiler/transpiler. For CoffeeScript you can directly
pass options to the node command:
Therefore instead of doing
node --debug app.js
You can write:
coffee --nodejs --debug app.coffee
This will listen for debugging instructions on port 5858 (can be modified). We
can now launch the debugger interface with:
node-inspector
Again, if your default browser is Chrome or Opera, this will also open it on a
new tab. Otherwise you will have to open it by yourself.
Running inside a virtual machine or container
If you run your code inside a docker container or
vagrant virtual machine, you will notice this
doesn’t work. Furthermore where should you launch the inspector from?
Before going on, I would like to recall about the ports. In order to use
node-inspector, we need to use two different ports:
- The debugger port, which defaults to 5858. This allows our two processes
to communicate together. This can be changed by directly passing an argument
to thedebugoption:--debug=5856 - The interface port, which defaults to 8080. This is basically a web server
that allows us, the developer, to place breakpoints, live edit the code,
etc. You can set this port by passing theweb-portoption with a parameter
-web-port 10100.
If those ports are already being used by some processes you will have to use
the options mentioned above. Understanding this will help you not to mess up.
Yet this is not enough. When running a server within a container, you also need
to run the node-inspector inside the container. Therefore you need to set the
address of the web server to match container’s.
Example
To put it in a nutshell, let’s say I am running my server inside a vagrant with
a local ip of 199.199.199.42. Also I am already using the ports 5858 and 8080 so
I’ll have to use others.
If you want to test you can use the simple js file:
var http = require('http');

// I won't be able to use it for the debugger interface
const PORT = 8080;

function handleRequest(request, response) {
  response.end('It Works!! Path Hit: ' + request.url);
}

var server = http.createServer(handleRequest);

server.listen(PORT, function() {
  console.log("Server listening on: http://localhost:%s", PORT);
});
First, start the server in debug mode:
node --debug=5656 server.js
Then start the node-inspector:
node-inspector --web-host=199.199.199.42 --debug-port=5656 --web-port=10100 --no-preload
This will output something like Visit http://199.199.199.42:10100/?ws=199.199.199.42:10100&port=5656 to start debugging. and won’t open a tab on your browser.
Finally go to the provided address on your host and start debugging!
Side notes
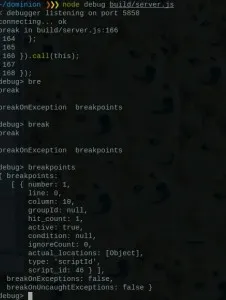
- It is important to note the difference between
node debug server.jsandnode --debug server.js. The first one will directly launch the debugger on the
console while the second one opens a port to listen for debugging instructions. - You can also break right after launching the application by using the
--debug-brkoption. Which is useful to manually enter some breakpoints at
given lines - Long parameters were used to improve readability:
--web-portcan be shortened to-p--debug-portcan be shortened to-d